MidTerms 2026 – Elections for 35 U.S. Senate Races and all members of the U.S. House of Representatives
Listen to this Debate on the MidTerms on any device, CLICK PLAY.
Watch the short video and you’ll get a good picture of what the November 3rd election looks like:
Gardner Magazine has a number of reports along with highly detailed and informative infographics. Read them all on this page or download this 52 page Gardner Magazine ebook.
Jump to section: Data-Driven Midterm Shakeup – 4 Surprising Takeaways —– Demystifying U.S. Midterm Elections: A Learner’s Guide to Congress, Polling, and Probabilities —–Electoral Risk Assessment: Midterm Congressional Balance of Power & Strategic Projections —–Demystifying Political Forecasting: How Pollsters Measure Elections and Predict Majorities —–
Executive Memorandum: Midterm Electoral Landscape and Legislative Power Dynamics —–Various Analysis Infographics
The Data-Driven Midterm Shakeup: 4 Surprising Takeaways from the Latest Election Models
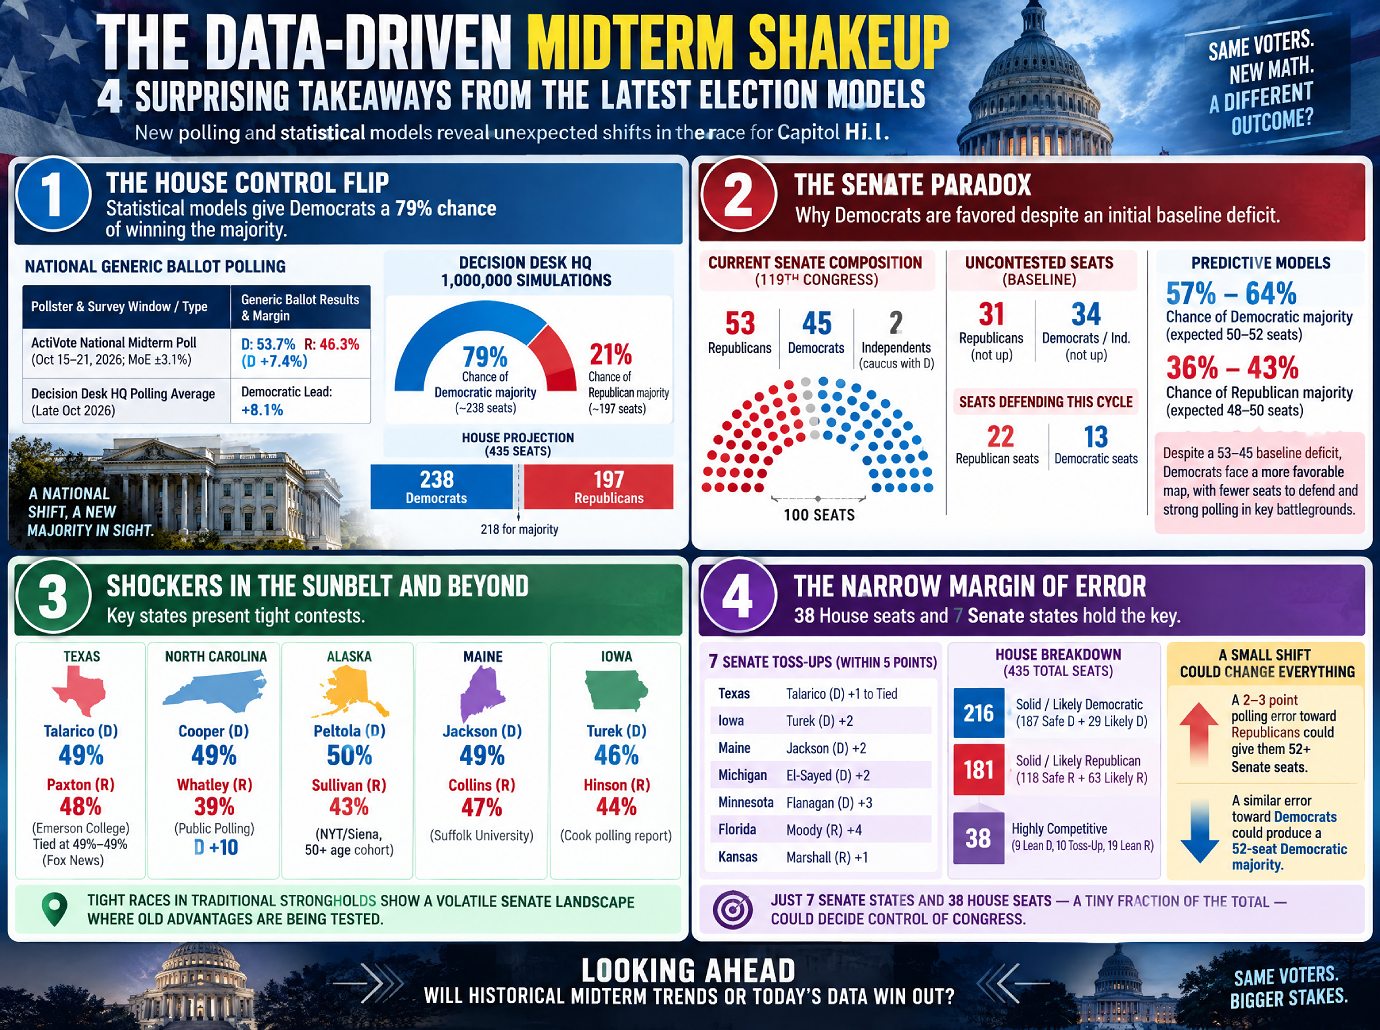
The Data-Driven Midterm Shakeup: 4 Surprising Takeaways from the Latest Election Models
Predicting midterm election outcomes often feels like hitting a moving target, but raw polling data combined with advanced statistical modeling offers a clear window into voter intent. Recent predictive runs reveal unexpected shifts across both the U.S. House and U.S. Senate races that challenge standard political assumptions. An analysis of recent model outputs from Decision Desk HQ, Emerson College, Marist University, New York Times/Siena, and ActiVote points to two distinct regional and institutional dynamics shaping the high-stakes battle for Capitol Hill.
The House Control Flip: Statistical Models Give Democrats a 79% Chance of Winning the Majority
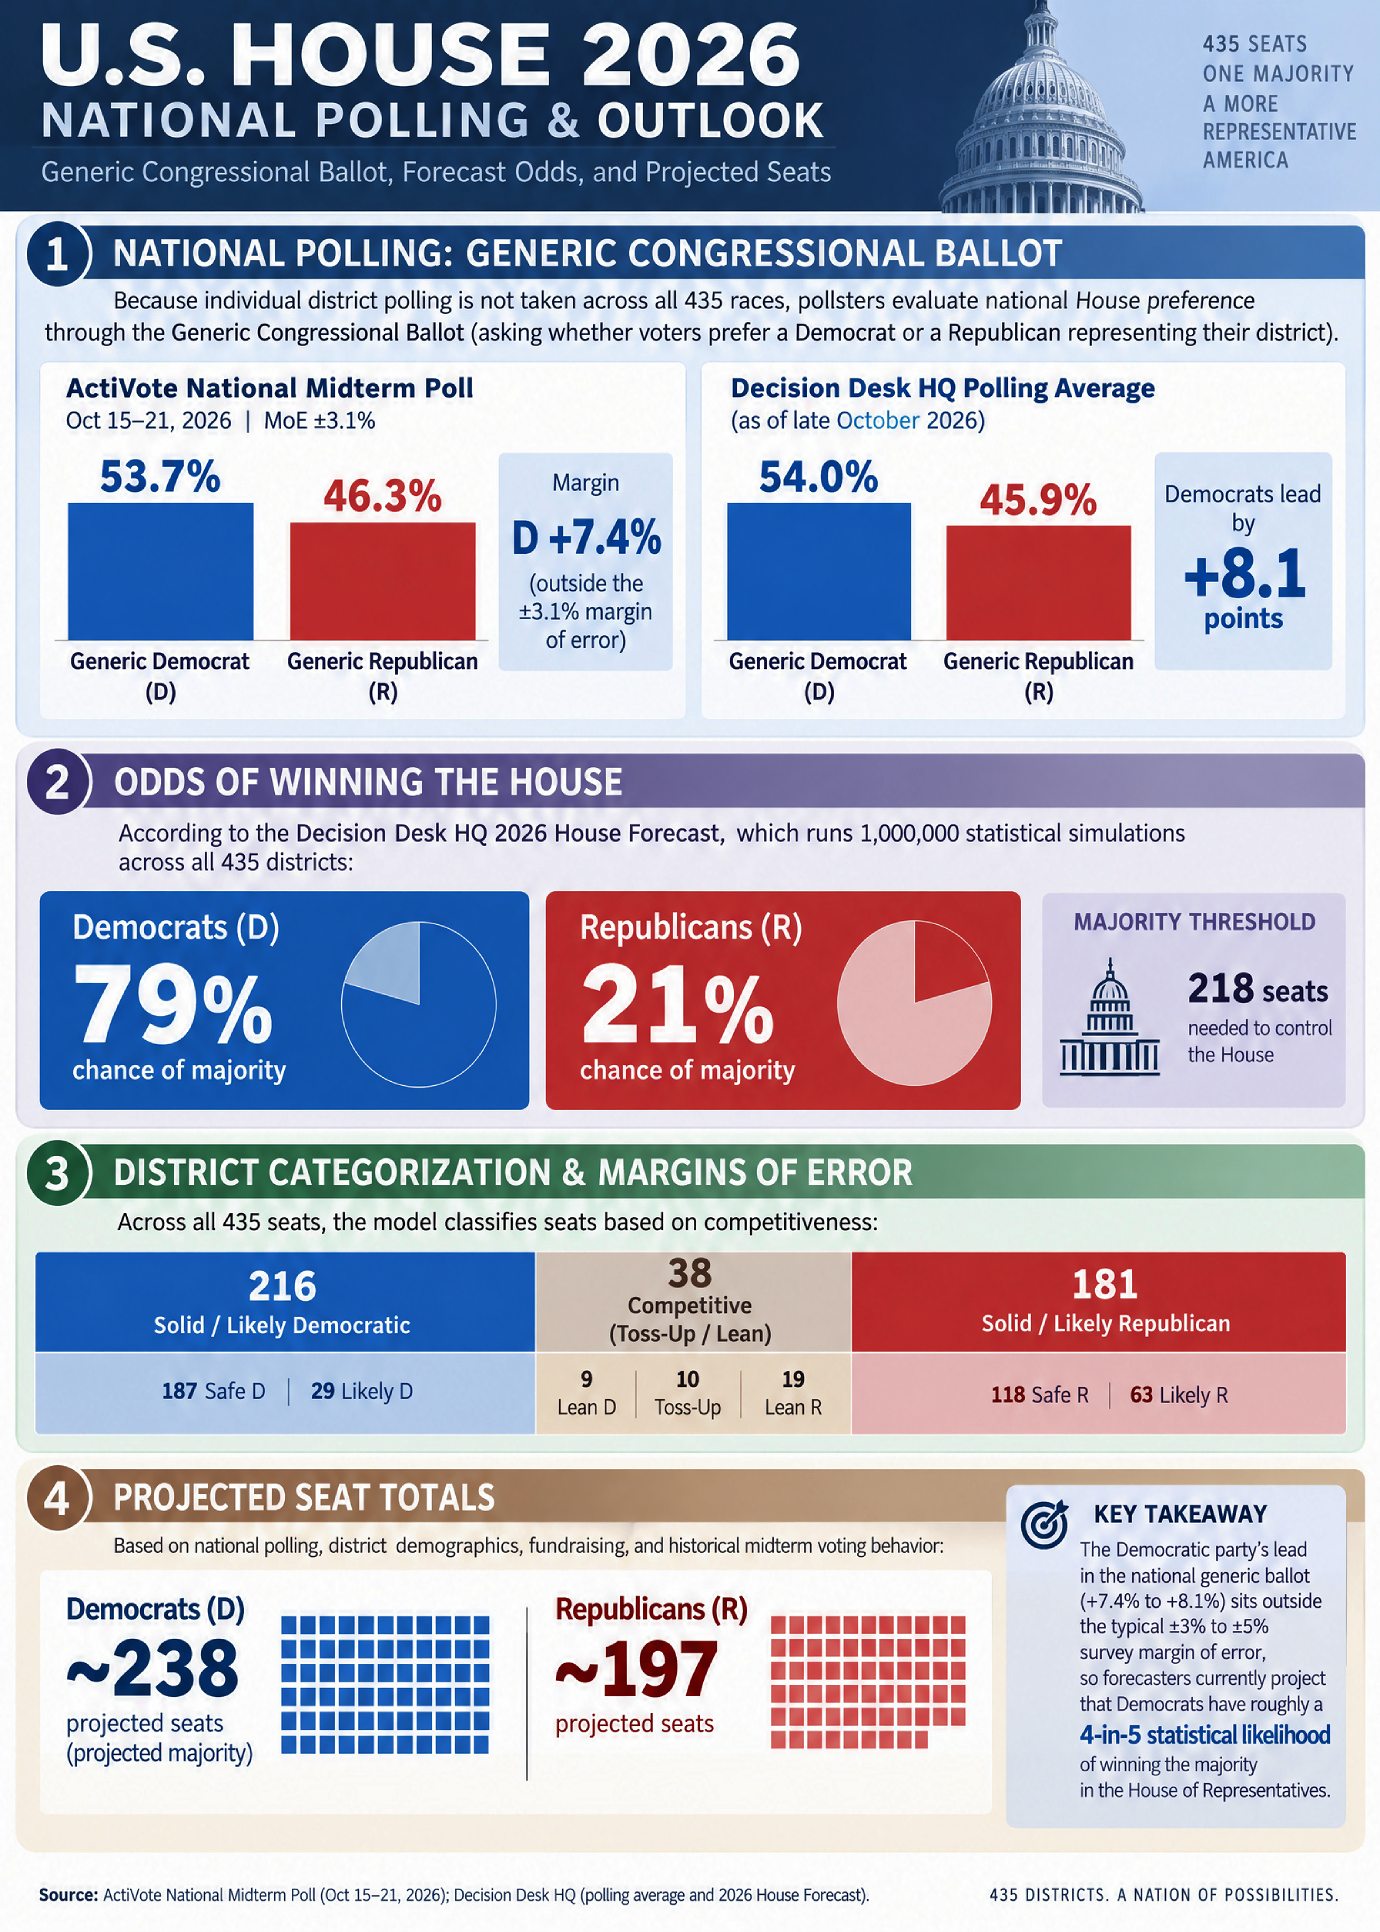
National generic ballot polling serves as the baseline metric for forecasting overall House control. When national preferences shift beyond standard survey noise, statistical simulations translate those generic leads into concrete seat distributions across all 435 congressional districts.
| Pollster & Survey Window / Type | Generic Ballot Results & Margin |
|---|---|
| ActiVote National Midterm Poll (Oct 15–21, 2026; MoE ±3.1%) | Generic D: 53.7% vs. Generic R: 46.3% (D +7.4%) |
| Decision Desk HQ Polling Average (Late Oct 2026) | Generic D Lead: +8.1% |
Because the Democratic lead (+7.4% to +8.1%) sits comfortably outside the standard survey margin of error (±3% to ±5%), models project a decisive structural advantage. Decision Desk HQ’s 1,000,000 statistical simulations project a 79% probability of a Democratic House majority (~238 projected seats) versus a 21% probability for Republicans (~197 projected seats).
The Senate Paradox: Why Democrats Are Favored Despite an Initial Baseline Deficit
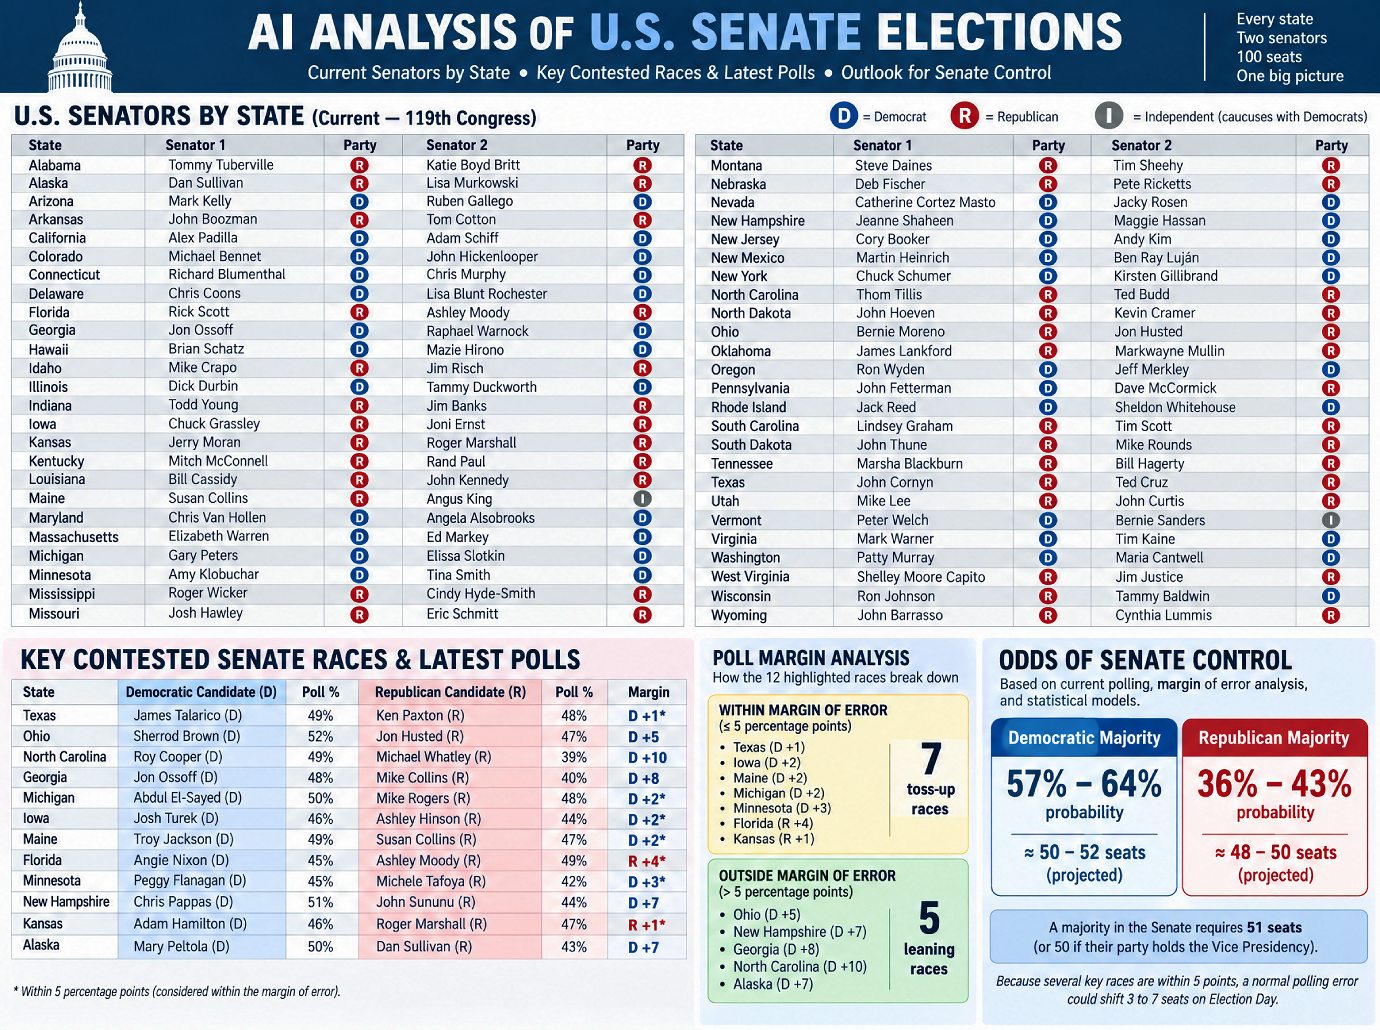
Entering this election cycle, the baseline party composition of the 119th Congress stands at 53 Republicans, 45 Democrats, and 2 Independents who caucus with Democrats. Uncontested seat baselines reflect this initial Republican edge:
- Republicans: Hold 31 seats not up for contest.
- Democrats / Independents: Hold 34 seats not up for contest.
Despite this baseline deficit, predictive models give Democrats a 57% to 64% probability of winning the Senate majority (expected 50 to 52 seats), compared to a 36% to 43% probability for Republicans (expected 48 to 50 seats).
This paradox is explained by the structural asymmetry of the 35 contested seats. Because Republicans hold 31 uncontested seats out of their 53-seat total, they are defending 22 seats this cycle. By contrast, Democrats and Independents hold 34 uncontested seats out of their 47-seat baseline, meaning they are defending only 13 seats. Out of these 35 total contested seats, approximately 18 are safe, non-competitive contests in deeply partisan states (e.g., Wyoming, Idaho, Alabama, Massachusetts). With non-competitive seats set aside, strong Democratic polling performances across the narrow band of remaining battlegrounds tilt the statistical odds toward Democrats capturing at least 50 seats.
Shockers in the Sunbelt and Beyond: Key States Present Tight Contests
Individual state polling highlights highly competitive dynamics in key Senate battlegrounds:
- Texas: Talarico (D) 49% vs. Paxton (R) 48% (Emerson College); Tied at 49% to 49% (Fox News)
- North Carolina: Cooper (D) 49% vs. Whatley (R) 39% (D +10, Public Polling)
- Alaska: Peltola (D) 50% vs. Sullivan (R) 43% (New York Times / Siena, 50+ age cohort)
- Maine: Jackson (D) 49% vs. Collins (R) 47% (Suffolk University)
- Iowa: Turek (D) 46% vs. Hinson (R) 44% (Cook polling report cited in dataset)
Key polling leads inside traditional strongholds and tight margins against long-term incumbents demonstrate a volatile Senate landscape where traditional geographic advantages are being tested.
The Narrow Margin of Error: 38 House Seats and 7 Senate States Hold the Key
Applying the rule that races separated by 5 percentage points or fewer fall within the statistical margin of error reveals that overall national control hinges on a tiny fraction of total races.
Senate Toss-Ups (Within 5 Points):
- Texas: Talarico (D) +1 to Tied (0 to 1 pt margin)
- Iowa: Turek (D) +2
- Maine: Jackson (D) +2
- Michigan: El-Sayed (D) +2
- Minnesota: Flanagan (D) +3
- Florida: Moody (R) +4
- Kansas: Marshall (R) +1
House Breakdown (435 Total Seats):
- Solid / Likely Democratic: 216 seats (187 Safe D + 29 Likely D)
- Solid / Likely Republican: 181 seats (118 Safe R + 63 Likely R)
- Highly Competitive (Within Margin of Error): 38 seats (9 Lean D, 10 Pure Toss-Up, 19 Lean R)
With 7 Senate states within 5 percentage points, polling errors carry decisive consequences. A systemic polling error of just 2 to 3 points favoring Republicans would flip tight contests in Texas, Iowa, Maine, Michigan, and Kansas, handing Republicans 52 or more seats. Conversely, a standard polling error favoring Democrats would secure wins across those same razor-thin battlegrounds, producing a 52-seat Democratic Senate majority.
Looking Ahead: Historical Trends vs. Statistical Models
The data outlines two distinct stories for the upcoming midterms: a high-probability House flip driven by national generic ballot leads outside the margin of error, paired with a Senate chamber hanging on a razor’s edge across seven close state races.
As voters head to the polls, one key question remains: Will systemic polling errors lean toward historical midterm tendencies, or will the final results validate the current statistical projections?
====================================================================
Demystifying U.S. Midterm Elections: A Learner’s Guide to Congress, Polling, and Probabilities
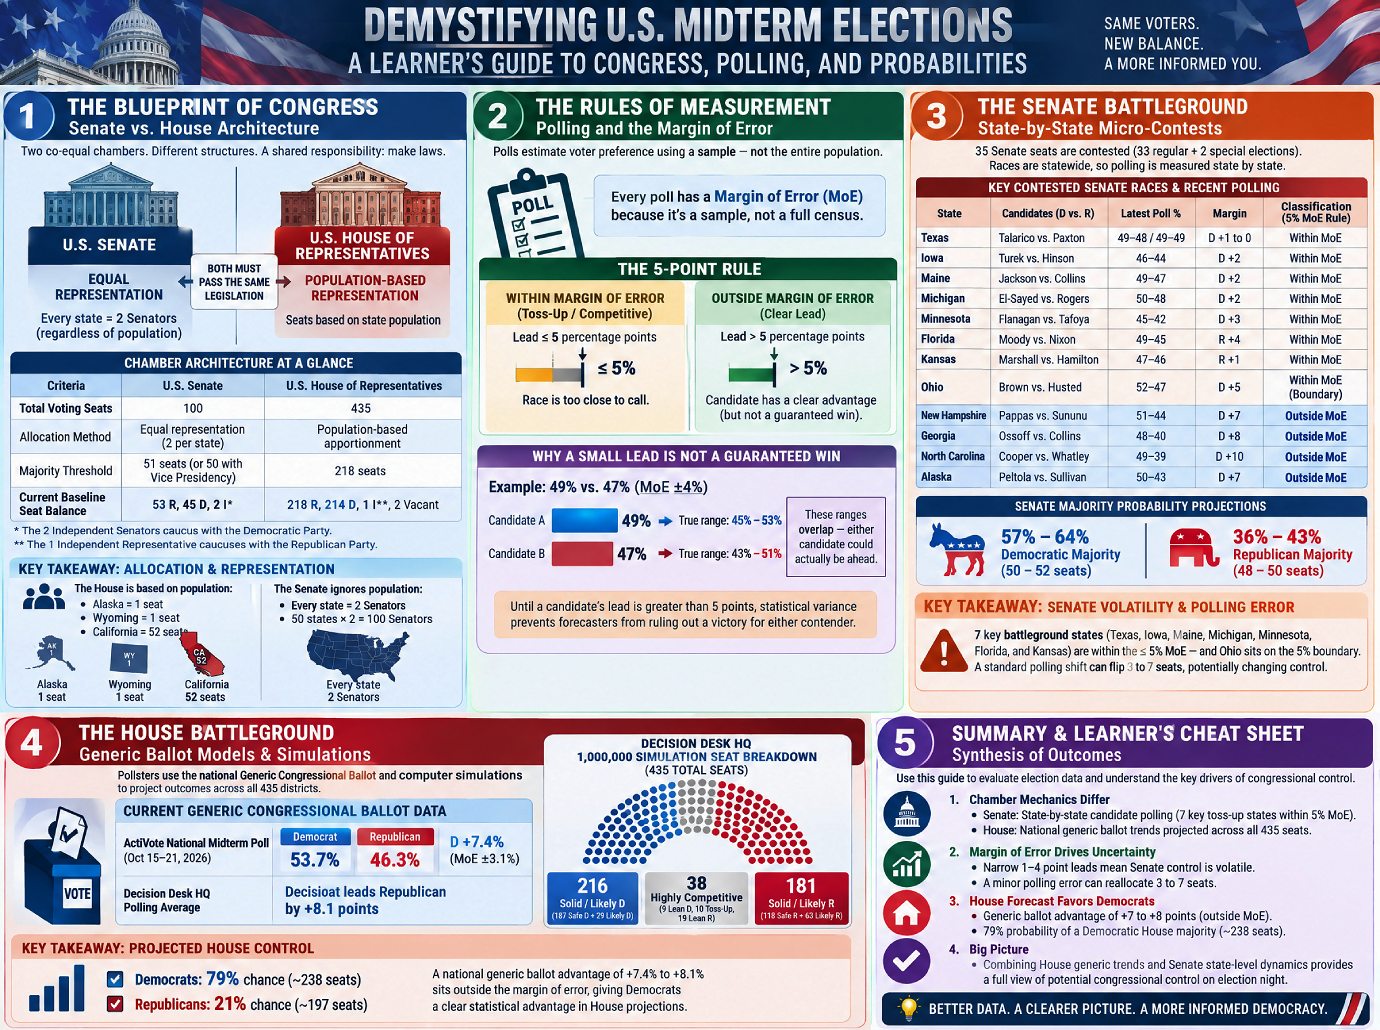
Demystifying U.S. Midterm Elections: A Learner’s Guide to Congress, Polling, and Probabilities
1. The Blueprint of Congress: Senate vs. House Architecture
Welcome to this foundational guide on United States midterm elections! To evaluate how federal power shifts during an election cycle, political scientists begin by examining the structural architecture of the U.S. Congress. The national legislature is bicameral, divided into two distinct, co-equal bodies: the United States Senate and the House of Representatives.
While both chambers must collaborate to draft and pass legislation, they are designed on contrasting structural foundations. The Senate reflects the principle of equal state sovereignty, according each state equal representation regardless of population size. Conversely, the House is structured around proportional representation, allocating voting seats based on state population distributions. Achieving majority control in either chamber requires reaching a specific seat threshold calculated from its total voting membership.
Chamber Architecture at a Glance
| Criteria | U.S. Senate | U.S. House of Representatives |
|---|---|---|
| Total Voting Seats | 100 | 435 |
| Allocation Method | Equal representation (2 per state) | Population-based apportionment |
| Majority Threshold | 51 seats (or 50 with Vice Presidency) | 218 seats |
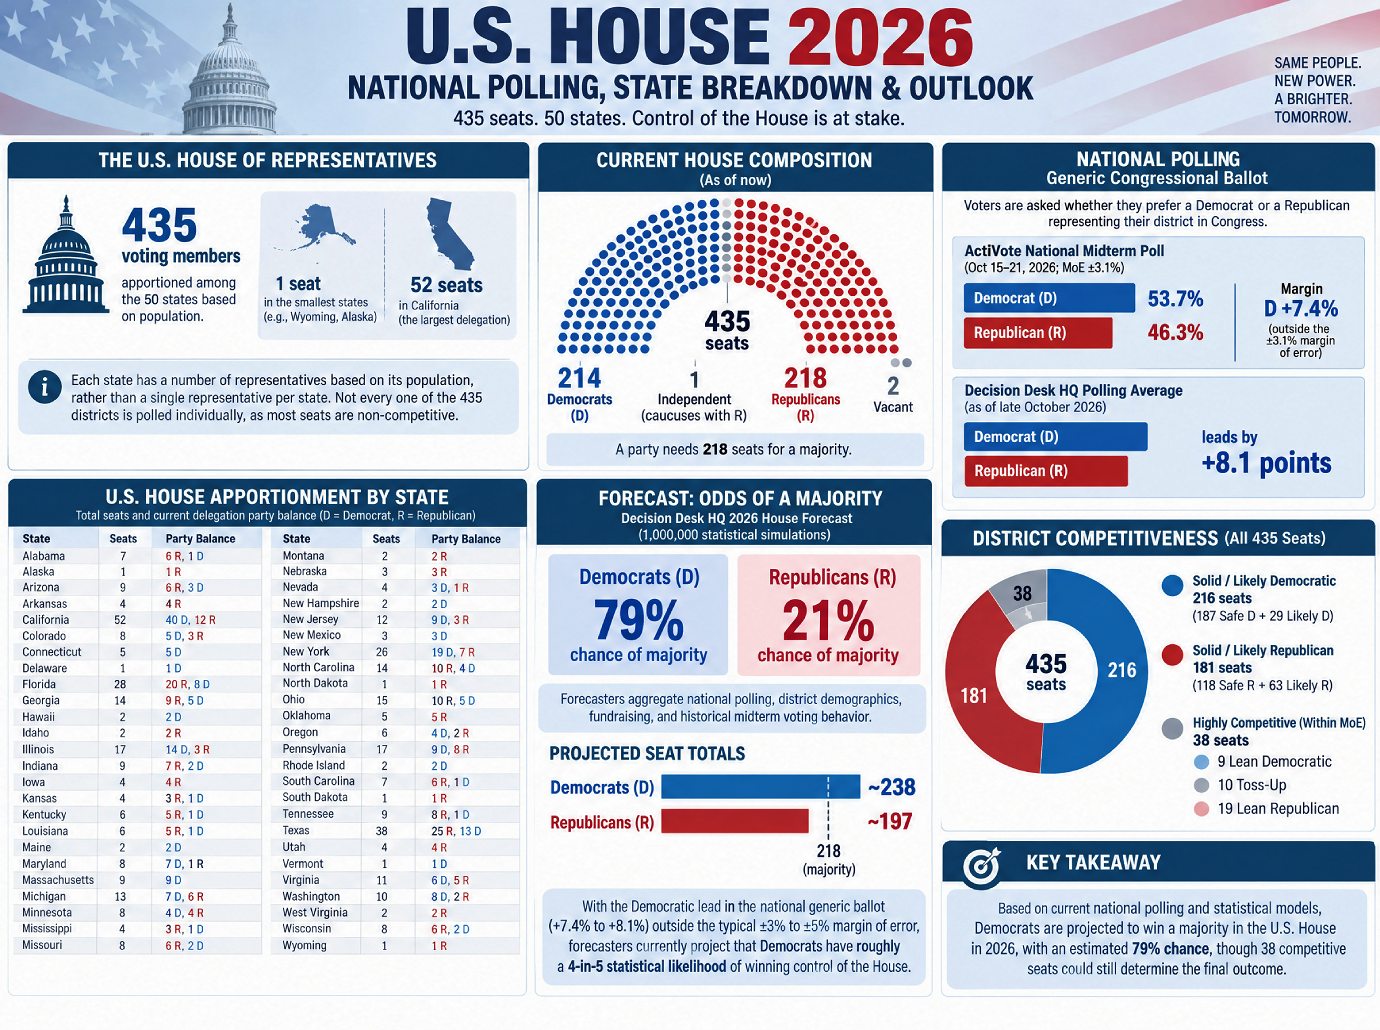
| Current Baseline Seat Balance | 53 Republicans (R), 45 Democrats (D), 2 Independents (I)* | 218 Republicans (R), 214 Democrats (D), 1 Independent (I)**, 2 Vacant |
*The 2 Independent Senators caucus with the Democratic Party. **The 1 Independent Representative caucuses with the Republican Party.
Key Takeaway: Allocation & Representation Why individual state size dictates House representation while Senate representation remains static: In the House of Representatives, representation is directly tied to population. Single-district states like Alaska and Wyoming receive only 1 seat, whereas heavily populated states like California receive 52 seats. Conversely, the Senate operates within a rigid 50-state structure where population density is ignored entirely: every single state receives exactly 2 Senators, establishing a fixed 100-member body ($50 \text{ states} \times 2 = 100 \text{ Senators}$).
Understanding these structural chamber rules provides the necessary framework for analyzing how pollsters measure voter sentiment leading up to an election.
2. The Rules of Measurement: Polling and the Margin of Error
When analyzing election dynamics, political scientists rely on public opinion polling to gauge voter preference. Because pollsters cannot survey every eligible citizen, they collect responses from a representative statistical sample. Because a sample is an estimate of the total population, every poll carries an inherent statistical Margin of Error (MoE).
In political science analysis, a 5-percentage-point lead serves as the standard baseline threshold for identifying whether a contest is genuinely competitive or clearly leaning toward one candidate:
- Within Margin of Error (Toss-Up / Competitive): Races where a candidate’s lead is $\le 5\%$ percentage points.
- Outside Margin of Error (Clear Lead): Races where a candidate’s lead is $> 5\%$ percentage points.
Why a Small Lead Is Not a Guaranteed Win
Why can’t a candidate holding a 1-to-4-point lead (such as in Texas, Iowa, or Michigan) be declared a definitive frontrunner? The answer lies in sampling variance. When a poll shows a candidate leading 49% to 47% with a standard survey margin of error of $\pm 3\%$ to $\pm 5\%$, the true underlying support for each candidate exists within a range rather than a single point estimate.
For instance, applying a $\pm 4\%$ MoE to a 49% vs. 47% result yields a true support range of 45% to 53% for the lead candidate and 43% to 51% for the trailing candidate. Because these confidence intervals overlap significantly, the candidate polling at 47% could realistically hold a true lead of 51% to 45% in the broader voting population. Until a candidate’s lead expands past the 5-point threshold ($> 5\%$), statistical variance prevents forecasters from ruling out a victory for either contender.
With these theoretical margin of error principles established, we can now apply them to real-world state Senate contests.
3. The Senate Battleground: State-by-State Micro-Contests
Unlike national presidential elections, Senate contests are statewide elections. A total of 35 Senate seats are contested in this cycle (33 regular Class II seats plus 2 special elections). Non-contested baseline seats account for 31 Republican seats and 34 Democratic/Independent seats. Out of the 35 contested seats, roughly 18 sit in heavily partisan states (e.g., Wyoming, Idaho, Arkansas, Alabama, Massachusetts, Rhode Island, Delaware) where the risk of a party flip is minimal.
Because Senate races are statewide, pollsters measure candidates on a localized, state-by-state basis rather than through a single aggregate national model.
Key Contested Senate Races & Recent Polling
| State | Candidates & Party | Latest Poll Percentages (Pollster Source) | Point Spread / Margin | Classification (5% MoE Rule) |
|---|---|---|---|---|
| Texas | James Talarico (D) vs. Ken Paxton (R) | 49% vs. 48% (Emerson College) / 49% vs. 49% (Fox News) | D +1 to Tied (0 to 1 pt) | Within Margin of Error |
| Iowa | Josh Turek (D) vs. Ashley Hinson (R) | 46% vs. 44% (Cook) | D +2 | Within Margin of Error |
| Maine | Troy Jackson (D) vs. Susan Collins (R) | 49% vs. 47% (Suffolk University) | D +2 | Within Margin of Error |
| Michigan | Abdul El-Sayed (D) vs. Mike Rogers (R) | 50% vs. 48% (Marist University) | D +2 | Within Margin of Error |
| Minnesota | Peggy Flanagan (D) vs. Michele Tafoya (R) | 45% vs. 42% (KSTP / SurveyUSA) | D +3 | Within Margin of Error |
| Florida | Ashley Moody (R) vs. Angie Nixon (D) | 49% vs. 45% (Univ. of North Florida) | R +4 | Within Margin of Error |
| Kansas | Roger Marshall (R) vs. Adam Hamilton (D) | 47% vs. 46% (New York Times / Siena) | R +1 | Within Margin of Error |
| Ohio | Sherrod Brown (D) vs. Jon Husted (R) | 52% vs. 47% (Fox News) | D +5 | Within Margin of Error (Boundary Threshold) |
| New Hampshire | Chris Pappas (D) vs. John Sununu (R) | 51% vs. 44% (St. Anselm College) | D +7 | Outside Margin of Error |
| Georgia | Jon Ossoff (D) vs. Mike Collins (R) | 48% vs. 40% (Atlanta Journal-Constitution) | D +8 | Outside Margin of Error |
| North Carolina | Roy Cooper (D) vs. Michael Whatley (R) | 49% vs. 39% (Public Polling) | D +10 | Outside Margin of Error |
| Alaska | Mary Peltola (D) vs. Dan Sullivan (R) | 50% vs. 43% (New York Times / Siena, 50+ cohort) | D +7 | Outside Margin of Error |
Senate Majority Probability Projections
Applying statistical models to these localized polling dynamics yields the following baseline majority projections:
- Democratic Majority Probability: 57% to 64% chance (projected expected baseline of 50 to 52 seats).
- Republican Majority Probability: 36% to 43% chance (projected expected baseline of 48 to 50 seats).
Key Takeaway: Senate Volatility & Polling Error Because candidate leads in 7 key battleground states (Texas, Iowa, Maine, Michigan, Minnesota, Florida, and Kansas) sit within the $\le 5\%$ margin of error threshold—and Ohio sits directly on the 5.0% boundary—a standard polling shift or systemic sampling variation can shift 3 to 7 seats on Election Day, completely altering chamber control.
Shifting focus from these state-level Senate micro-contests requires examining the macro-level statistical modeling used to predict House outcomes.
4. The House Battleground: Generic Ballot Models & Simulations
Predicting outcomes in the U.S. House of Representatives requires a different methodological approach. Pollsters cannot realistically survey all 435 individual congressional districts, as localized polling is unavailable for non-competitive seats.
To model House outcomes, statisticians rely on the Generic Congressional Ballot—a national survey question asking voters whether they plan to vote for a generic Democrat or Republican in their district—and pair those findings with 1,000,000 statistical district-level computer simulations.
Current Generic Congressional Ballot Data
- ActiVote National Midterm Poll (Oct 15–21, 2026): Generic Democrat 53.7% vs. Generic Republican 46.3% (D +7.4%, MoE $\pm 3.1\%$).
- Decision Desk HQ Polling Average: Generic Democrat leads Generic Republican by +8.1 points.
Decision Desk HQ 1,000,000 Simulation Seat Breakdown (435 Total Seats)
| Category | Seat Count | Breakdown Details |
|---|---|---|
| Solid / Likely Democratic | 216 seats | 187 Safe D + 29 Likely D |
| Solid / Likely Republican | 181 seats | 118 Safe R + 63 Likely R |
| Highly Competitive (Within MoE) | 38 seats | 9 Lean D, 10 Pure Toss-Up, 19 Lean R |
Key Takeaway: Projected House Control Statistical models project Democrats with a 79% likelihood of capturing the House majority (~238 seats), compared to Republicans at a 21% likelihood (~197 seats). This statistical advantage is driven primarily by national generic ballot polling (+7.4% to +8.1%) that consistently sits outside the survey margin of error.
Synthesizing both House generic trends and Senate state-level dynamics provides learners with a unified framework for evaluating total congressional control on election night.
5. Summary & Learner’s Cheat Sheet: Synthesis of Outcomes
Use this cheat sheet to evaluate incoming election data and understand the structural drivers of congressional outcomes:
- Chamber Mechanics Differ: Senate majority outcomes hinge on state-by-state candidate polling across localized battlegrounds (featuring 7 key toss-up states within a 5% MoE). Conversely, House outcomes depend on macro-level national generic ballot trends projected across all 435 seats.
- Margin of Error Drives Uncertainty: Narrow leads of 1 to 4 percentage points in Senate races mean majority control remains volatile. A minor polling error on election day can reallocate 3 to 7 seats between the parties.
- House Forecast Favors Democrats: A national generic ballot advantage exceeding +7 points places the Democratic lead outside the statistical margin of error, yielding a 79% projection probability for a House majority (~238 seats).
=========================================================================
Electoral Risk Assessment: Midterm Congressional Balance of Power & Strategic Projections
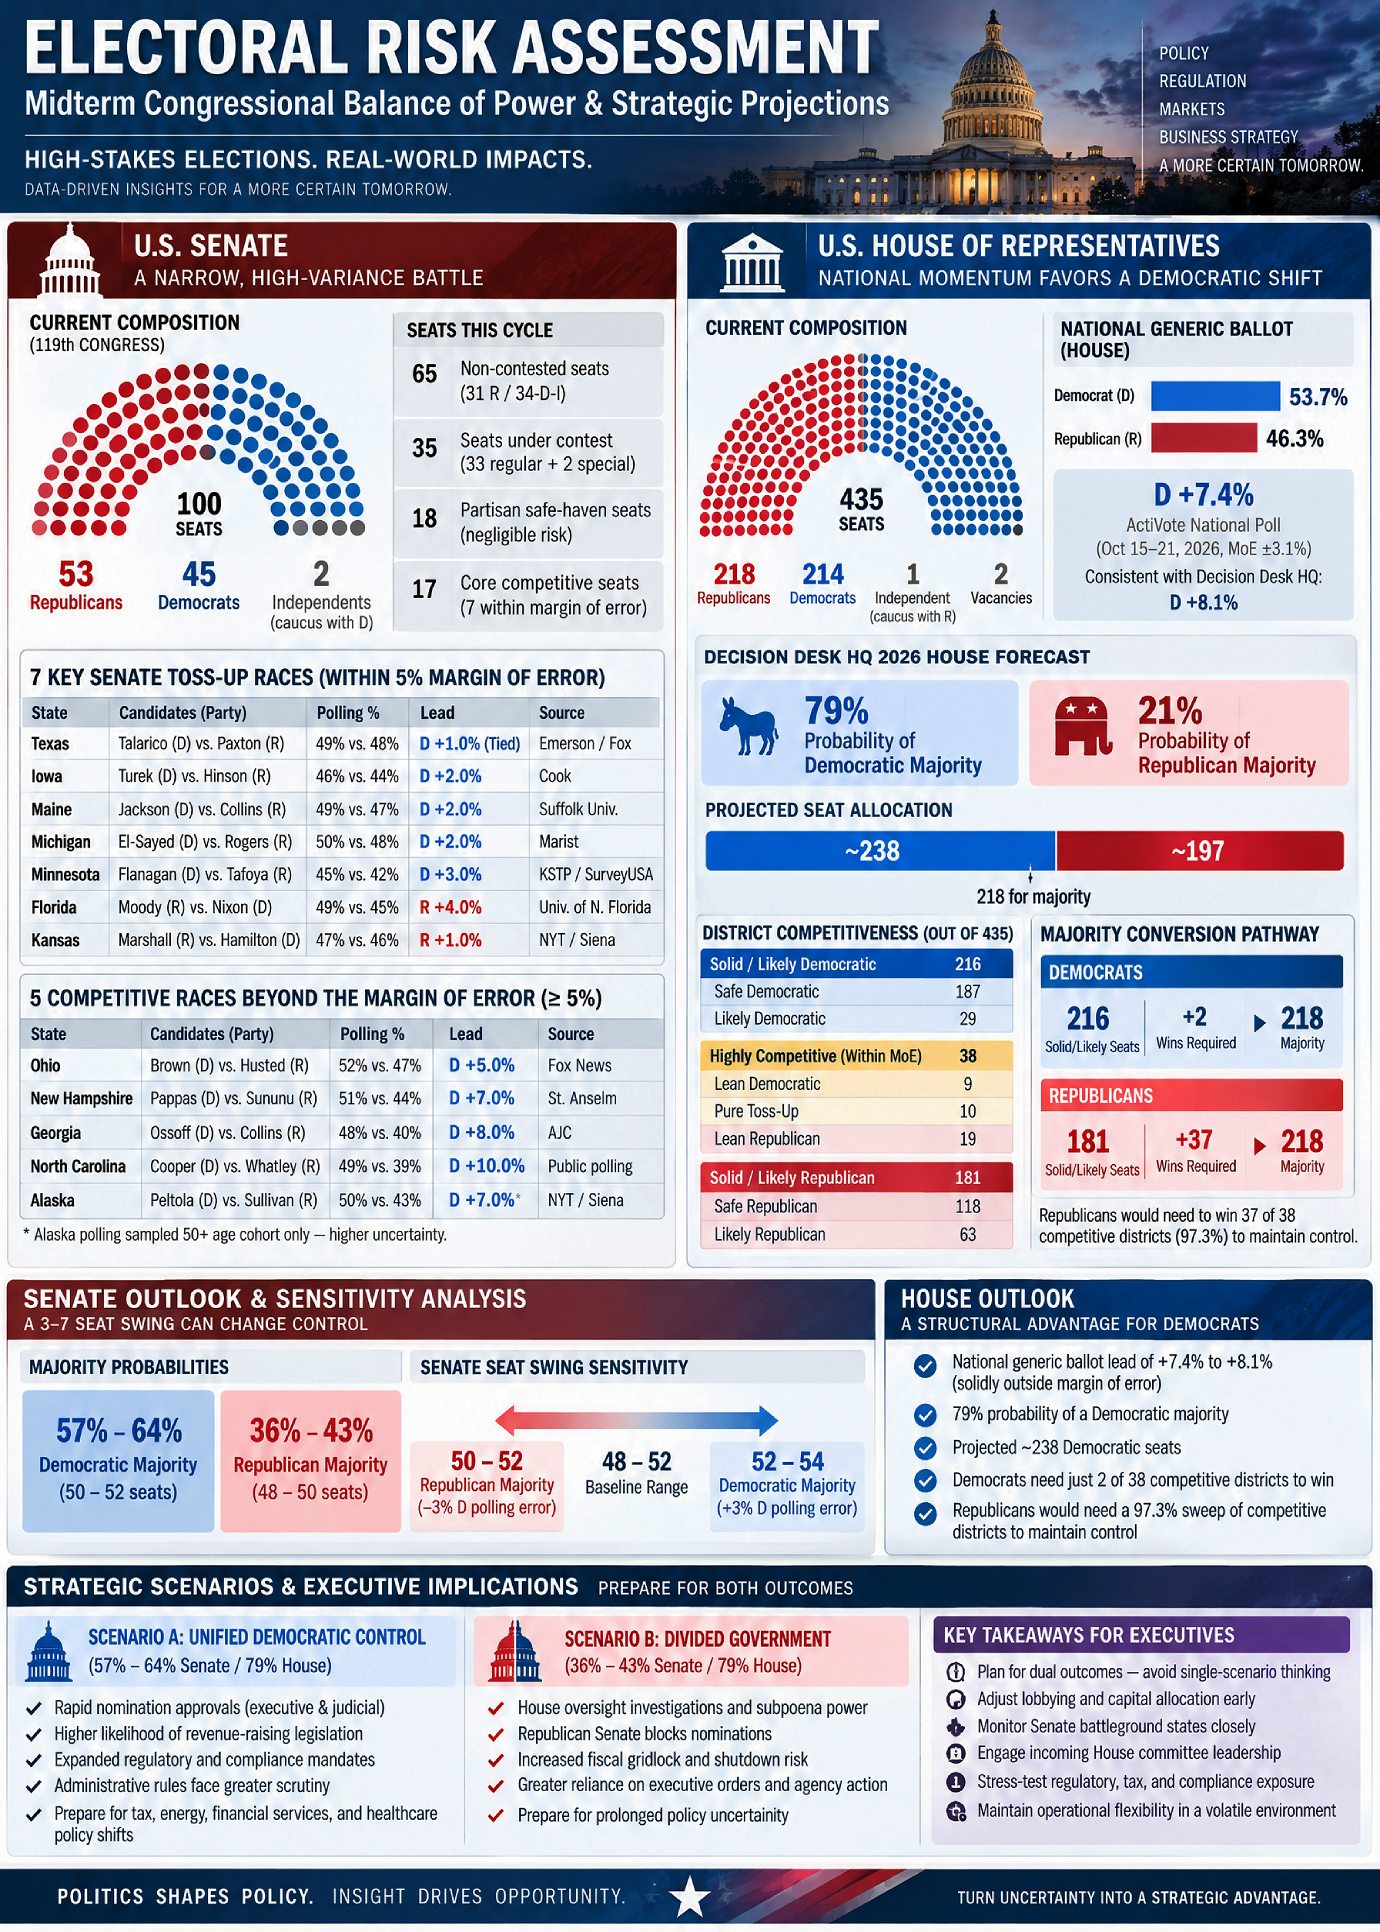
Electoral Risk Assessment: Midterm Congressional Balance of Power & Strategic Projections
1. Senate Balance of Power & Micro-Level Contest Analysis
1.0 Introductory Synthesis
Evaluating the United States Senate balance of power is a foundational requirement for executive risk modeling, regulatory planning, and corporate strategy. Because the Senate holds exclusive constitutional jurisdiction over executive branch appointments, judicial confirmations, and treaty ratifications—while serving as an indispensable legislative gatekeeper—even minor shifts in party alignment drastically alter policy exposure. Baseline party distributions, high-stakes toss-up races, and potential survey sampling errors collectively dictate the viability of executive agendas. By evaluating micro-level state polling alongside structural baseline constraints, strategic planners can quantify downside risks, anticipate regulatory pivots, and stress-test corporate advocacy frameworks against competitive electoral scenarios.
1.1 Baseline Composition & Non-Competitive Seat Dynamics
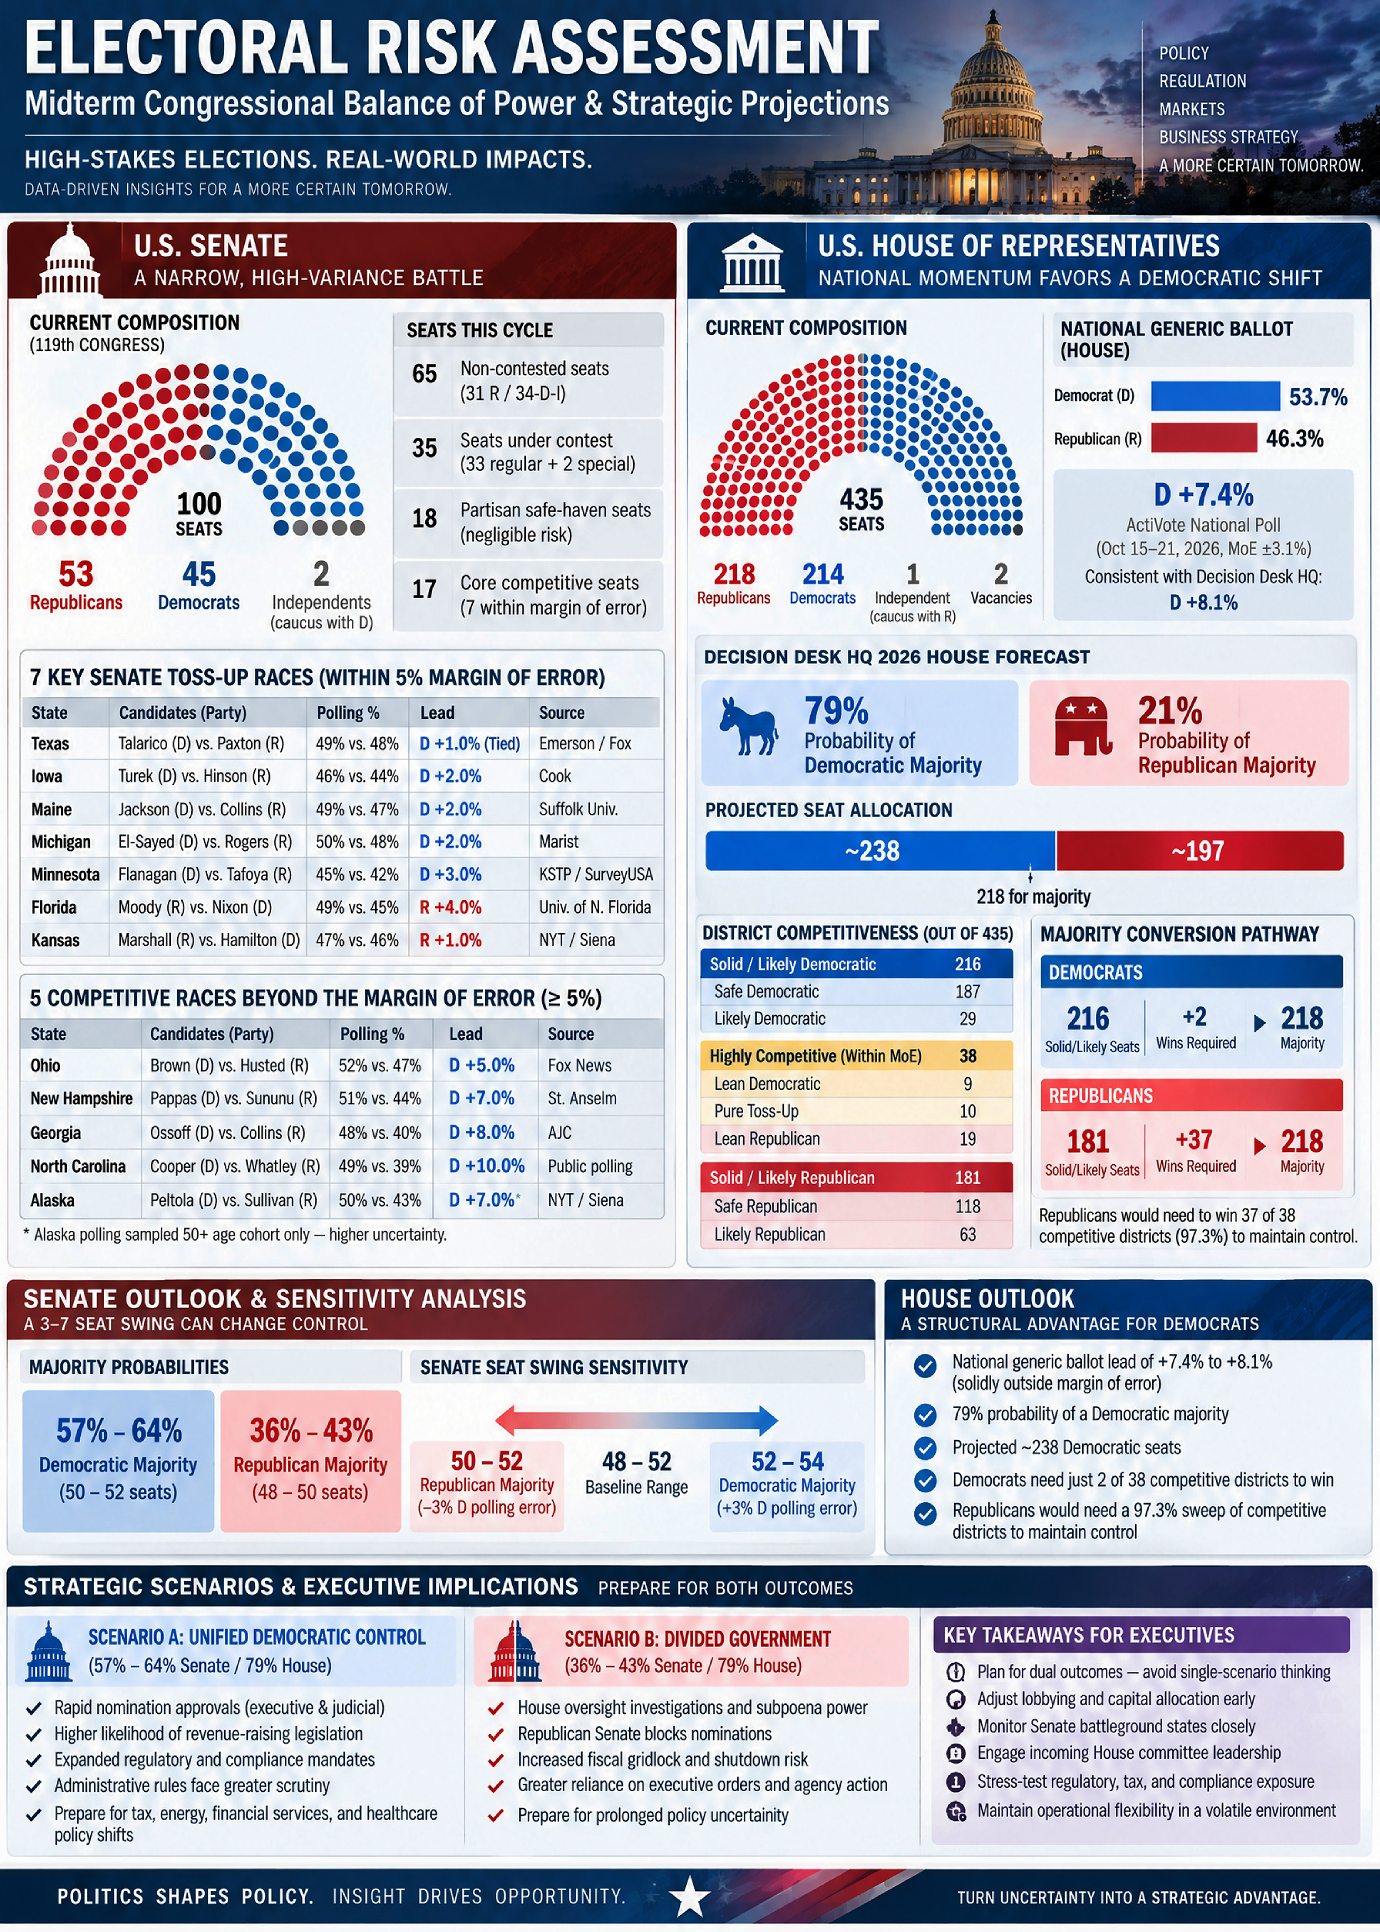
In the 119th Congress, the baseline party distribution stands at 53 Republicans (R), 45 Democrats (D), and 2 Independents (I) who caucus with the Democratic majority. A total of 65 seats are non-contested in this cycle, establishing a rigid baseline for both parties prior to factoring in competitive contests.
Baseline Senate Distribution & Contested Seat Breakdown
- Republican Non-Contested Baseline: 31 Seats
- Democratic / Independent Non-Contested Baseline: 34 Seats (32 D, 2 I)
- Total Seats Under Contest: 35 Seats (33 regular Class II seats + 2 special elections)
- Partisan Safe-Haven Seats: ~18 Seats (Negligible risk of flipping)
- Core Competitive Map: 17 Seats (7 Within Margin of Error, 10 Beyond or Outer Boundary)
Of the 35 contested seats, approximately 18 reside within deeply partisan jurisdictions—including Alabama, Arkansas, Delaware, Idaho, Massachusetts, Rhode Island, and Wyoming—where structural voter composition renders party turnover statistically remote. Consequently, control of the Senate chamber hinges on a highly concentrated subset of competitive states.
1.2 Within-Margin-of-Error Toss-Up Race Evaluations
The primary vector of Senate volatility resides in 7 key contests where candidate polling leads fall within the standard 5-percentage-point margin of error (MoE) threshold. In these micro-battlegrounds, statistical noise obscures actual candidate placement, leaving chamber control hyper-sensitive to late-stage voter turnout shifts and localized campaign dynamics.
| State | Candidates & Parties | Polling Percentages | Lead Margin | Polling Source |
|---|---|---|---|---|
| Texas | James Talarico (D) vs. Ken Paxton (R) | 49% vs. 48% / Tied 49% to 49% | D +1.0% / Tied (0.0%) | Emerson College / Fox News |
| Iowa | Josh Turek (D) vs. Ashley Hinson (R) | 46% vs. 44% | D +2.0% | Cook |
| Maine | Troy Jackson (D) vs. Susan Collins (R) | 49% vs. 47% | D +2.0% | Suffolk University |
| Michigan | Abdul El-Sayed (D) vs. Mike Rogers (R) | 50% vs. 48% | D +2.0% | Marist University |
| Minnesota | Peggy Flanagan (D) vs. Michele Tafoya (R) | 45% vs. 42% | D +3.0% | KSTP / SurveyUSA |
| Florida | Ashley Moody (R) vs. Angie Nixon (D) | 49% vs. 45% | R +4.0% | Univ. of North Florida |
| Kansas | Roger Marshall (R) vs. Adam Hamilton (D) | 47% vs. 46% | R +1.0% | New York Times / Siena |
These narrow spreads illustrate significant baseline risk for both parties. Democrats hold delicate leads inside the margin of error across Texas (+1.0% to tied), Iowa (+2.0%), Maine (+2.0%), Michigan (+2.0%), and Minnesota (+3.0%). Conversely, Republicans maintain narrow leads inside the MoE in Florida (+4.0%) and Kansas (+1.0%). Because these margins fall within survey variance, minor operational shifts in ground-game turnout or independent voter swing on Election Day could cause a sweeping realignment of the Senate majority.
1.3 Contests Beyond the Margin of Error
In addition to the core toss-up battlegrounds, five competitive Senate races feature candidate leads that meet or exceed the 5-percentage-point statistical threshold:
- Ohio: Sherrod Brown (D) leads Jon Husted (R) 52% to 47% (Fox News), positioning the race directly on the 5.0% margin-of-error boundary.
- New Hampshire: Chris Pappas (D) leads John Sununu (R) 51% to 44% (St. Anselm College), establishing a D +7.0% margin.
- Georgia: Jon Ossoff (D) leads Mike Collins (R) 48% to 40% (Atlanta Journal-Constitution), building a D +8.0% margin.
- North Carolina: Roy Cooper (D) holds a 49% to 39% lead over Michael Whatley (R) in public polling, creating a D +10.0% margin.
- Alaska: Mary Peltola (D) leads Dan Sullivan (R) 50% to 43% in recent polling (New York Times / Siena).
Methodological Assessment: Alaska Polling Dynamics
A critical analytical caveat must be applied to the Alaska survey metric (Peltola D 50% vs. Sullivan R 43%). The underlying New York Times / Siena data was sampled exclusively from a 50+ age cohort demographic. Relying on a senior age cohort introduces pronounced sampling bias when projecting full-electorate turnout in Alaska. Older demographics historically skew toward higher participation and distinct policy preferences that do not mirror younger or non-contiguous rural voting blocs. Consequently, while the raw margin reports a D +7.0% lead, the structural volatility of Alaska remains substantially higher than indicated, requiring risk models to treat this state as a volatile, conditional lead rather than a secure Democratic buffer.
1.4 Probabilistic Majority Scenarios & Swing Sensitivity
Securing majority control of the Senate requires 51 seats (or 50 seats paired with the Vice Presidency). Integrating non-contested baselines, safe seats, and current state-level polling vectors yields the following probabilistic modeling distributions:
- Democratic Majority Probability: 57% to 64% likelihood (Projected baseline of 50 to 52 seats).
- Republican Majority Probability: 36% to 43% likelihood (Projected baseline of 48 to 50 seats).
Strategic Risk Modeling & Sensitivity Analysis (“So What?”)
From a political risk perspective, the elevated probability of Democratic retention must be weighed against tail-risk polling asymmetry. Because candidate spreads in core battlegrounds (Texas, Iowa, Maine, Michigan, Kansas, Florida) sit well within the 5.0% margin of error, a systemic polling error—equivalent to standard historical survey deviations—would alter the final distribution by 3 to 7 seats.
[SENATE SEAT SWING SENSITIVITY]Systemic Polling Error (-3.0% D) Systemic Polling Error (+3.0% D)[Republican Majority: 50-52 Seats] <--- Baseline Range: 48-52 ---> [Democratic Majority: 52-54 Seats]
A 3-point systematic polling error favoring Republicans would wipe out thin Democratic leads across Texas, Iowa, Maine, and Michigan, shifting chamber control to a 50-to-52 seat Republican majority. Conversely, a positive Democratic polling shift would lock in a 52-to-54 seat Democratic majority. Consequently, strategic planners must avoid treating the 57%–64% Democratic probability as a deterministic outcome and instead prepare for dual-outcome legislative contingency models.
1.5 Section Transition
While Senate control remains bound to highly volatile, state-specific micro-contests, the electoral environment governing the House of Representatives demonstrates a structurally distinct macro trend.
2. House of Representatives Electoral Landscape & Generic Ballot Dynamics
2.0 Introductory Synthesis
Assessing the 435-member House of Representatives requires a macro-structural analytical approach. Because individual, high-frequency polling across all 435 separate congressional districts is methodologically unfeasible—and unnecessary given that the vast majority of districts are geographically insulated—political risk modeling relies on national generic ballot tracking, demographic re-apportionment analysis, and nonpartisan statistical simulations. Integrating these aggregate metrics allows legislative affairs directors to assess national wave dynamics, project majority likelihoods, and evaluate structural floor allocations.
2.1 Baseline Delegation Composition & District Breakdown
The current overall House baseline stands at 218 Republicans, 214 Democrats, 1 Independent (who caucuses with Republicans), and 2 vacancies. Achieving a working operational majority requires 218 seats. The state-by-state delegation distribution across the 50 states is structured as follows:
| State | Total Seats | Current Delegation Split | State | Total Seats | Current Delegation Split |
|---|---|---|---|---|---|
| Alabama | 7 | 6 R, 1 D | Montana | 2 | 2 R |
| Alaska | 1 (At-large) | 1 R (Nicholas Begich) | Nebraska | 3 | 3 R |
| Arizona | 9 | 6 R, 3 D | Nevada | 4 | 3 D, 1 R |
| Arkansas | 4 | 4 R | New Hampshire | 2 | 2 D |
| California | 52 | 40 D, 12 R | New Jersey | 12 | 9 D, 3 R |
| Colorado | 8 | 5 D, 3 R | New Mexico | 3 | 3 D |
| Connecticut | 5 | 5 D | New York | 26 | 19 D, 7 R |
| Delaware | 1 (At-large) | 1 D | North Carolina | 14 | 10 R, 4 D |
| Florida | 28 | 20 R, 8 D | North Dakota | 1 (At-large) | 1 R |
| Georgia | 14 | 9 R, 5 D | Ohio | 15 | 10 R, 5 D |
| Hawaii | 2 | 2 D | Oklahoma | 5 | 5 R |
| Idaho | 2 | 2 R | Oregon | 6 | 4 D, 2 R |
| Illinois | 17 | 14 D, 3 R | Pennsylvania | 17 | 9 D, 8 R |
| Indiana | 9 | 7 R, 2 D | Rhode Island | 2 | 2 D |
| Iowa | 4 | 4 R | South Carolina | 7 | 6 R, 1 D |
| Kansas | 4 | 3 R, 1 D | South Dakota | 1 (At-large) | 1 R |
| Kentucky | 6 | 5 R, 1 D | Tennessee | 9 | 8 R, 1 D |
| Louisiana | 6 | 5 R, 1 D | Texas | 38 | 25 R, 13 D |
| Maine | 2 | 2 D | Utah | 4 | 4 R |
| Maryland | 8 | 7 D, 1 R | Vermont | 1 (At-large) | 1 D |
| Massachusetts | 9 | 9 D | Virginia | 11 | 6 D, 5 R |
| Michigan | 13 | 7 D, 6 R | Washington | 10 | 8 D, 2 R |
| Minnesota | 8 | 4 D, 4 R | West Virginia | 2 | 2 R |
| Mississippi | 4 | 3 R, 1 D | Wisconsin | 8 | 6 R, 2 D |
| Missouri | 8 | 6 R, 2 D | Wyoming | 1 (At-large) | 1 R |
This baseline highlights structural state delegation dynamics. Single-district states—such as Alaska, currently held by Nicholas Begich (R)—and highly clustered rural allocations establish structural seat floors for Republicans across the South and Midwest (e.g., Texas with 25 R seats, Florida with 20 R seats). Conversely, high-density coastal delegations establish substantial floor guarantees for Democrats (e.g., California with 40 D seats, New York with 19 D seats).
2.2 Macro Polling & National Generic Ballot Trends
National voter sentiment for the House of Representatives is measured primarily through generic congressional ballot preferences. Current macro-level polling indicates a consistent national lead for Democrats:
- ActiVote National Midterm Poll (Conducted Oct 15–21, 2026; MoE ±3.1%):
- Generic Democrat (D): 53.7%
- Generic Republican (R): 46.3%
- Margin: D +7.4%
- Decision Desk HQ Polling Average (Late October 2026):
- Generic Democrat (D) lead over Generic Republican (R): +8.1 points
The analytical significance of this trend is high: a national generic ballot margin of +7.4% to +8.1% sits fully outside the standard ±3.1% to ±5.0% survey margin of error, confirming that Democratic national strength represents a systemic preference shift rather than random polling variation.
2.3 Statistical Modeling, District Categorizations & Seat Projections
Translating national generic ballot margins into district outcomes requires simulating electoral distributions across varying district profiles. The Decision Desk HQ 2026 House Forecast model—leveraging 1,000,000 statistical simulations—yields the following chamber projections:
- Chamber Majority Probabilities:
- Democratic Majority: 79% probability
- Republican Majority: 21% probability
- Projected Seat Allocation Baselines:
- Democratic Projected Seats: ~238 seats (Majority baseline)
- Republican Projected Seats: ~197 seats
District Competitiveness Breakdown
Out of 435 total districts, the model categorizes district safety and competitiveness into three distinct tiers:
- Solid / Likely Democratic Baseline: 216 Seats
- Safe Democratic: 187 seats
- Likely Democratic: 29 seats
- Solid / Likely Republican Baseline: 181 Seats
- Safe Republican: 118 seats
- Likely Republican: 63 seats
- Highly Competitive / Within Margin of Error: 38 Seats
- Lean Democratic: 9 seats
- Pure Toss-Up: 10 seats
- Lean Republican: 19 seats
Strategic Risk Modeling & Capital Allocation Implications (“So What?”)
The mathematical mechanics of this district distribution reveal a critical floor advantage for Democrats. Because Democrats secure 216 seats within the Solid/Likely categories, capturing just 2 out of the 38 highly competitive swing districts (or lean seats) guarantees a Democratic House majority (216 + 2 = 218). Conversely, Republicans must capture 37 of the 38 competitive districts (a 97.3% sweep rate) to maintain control of the chamber.
[HOUSE MAJORITY CONVERSION PATHWAY]Democratic Base: 216 Solid/Likely Seats --------> [+2 Wins Required] --------> 218 Majority FloorRepublican Base: 181 Solid/Likely Seats --------> [+37 Wins Required] -------> 218 Majority Floor
This structural imbalance explains why simulation models assign Democrats a 79% (nearly 4-in-5) probability of taking the House. For corporate affairs and political risk executives, this high-probability shift demands immediate recalibration of legislative strategies prior to the convening of the new Congress. Corporate capital allocation, political action committee (PAC) deployment, and advocacy positioning must pivot immediately toward engaging incoming Democratic committee leadership in the House.
2.4 Section Transition
Synthesizing the high probability of a House majority shift alongside the micro-level volatility of the Senate provides the foundation for an integrated, multi-branch executive risk model.
3. Integrated Electoral Risk Assessment & Strategic Executive Implications
3.0 Introductory Synthesis
Cross-chamber political risk modeling requires synthesizing divergent electoral dynamics into an actionable legislative baseline. While individual chamber analyses provide micro and macro perspectives, executive decision-makers must manage policy exposure across the entire legislative branch. By comparing chamber-specific probabilities, structural margins, and legislative friction points, organizations can stress-test capital expenditure plans, anticipate regulatory shifts, and formulate regulatory defense strategies under unified or divided government scenarios.
3.1 Comparative Cross-Chamber Analysis
A comparative evaluation of the Senate and House landscapes highlights stark differences in structural stability, forecasting methodology, and risk exposure.
| Strategic Parameter | U.S. Senate Analysis | U.S. House of Representatives Analysis |
|---|---|---|
| Baseline Composition | 53 R / 45 D / 2 I (caucusing with D) | 218 R / 214 D / 1 I (caucusing with R) / 2 Vacancies |
| Contested Seats | 35 seats contested; 7 core toss-ups within MoE | All 435 seats up; 38 highly competitive within MoE |
| Survey Error Thresholds | State-level MoE = ±5.0 percentage points | National Generic MoE = ±3.1% (ActiVote) |
| Generic / Polling Trends | High micro-variance; leads range D +1.0% to R +4.0% | Macro national trend; D +7.4% to D +8.1% lead |
| Majority Probabilities | Dem Majority: 57%–64% | Rep Majority: 36%–43% | Dem Majority: 79% | Rep Majority: 21% |
| Projected Seat Baselines | Dem: 50 to 52 seats | Rep: 48 to 50 seats | Dem: ~238 seats | Rep: ~197 seats |
Strategic Risk Asymmetry
A critical strategic insight emerges from this comparison: the House exhibits high macro stability driving toward a party flip, whereas the Senate remains bound to volatile micro-level state dynamics.
The House forecast is anchored by a persistent national generic ballot lead (D +7.4% to +8.1%) sitting well outside the margin of error, giving Democrats a robust 79% probability of reaching ~238 seats. Conversely, the Senate majority depends heavily on 7 individual state races where candidate margins fall within a tight 1-to-4 point window. A modest 2-point turnout shift in states like Texas, Iowa, or Maine could alter Senate control without impacting the national House outcome. Risk models must account for this asymmetry: House strategy can rely on national trend lines, while Senate strategy requires state-specific sensitivity analysis.
3.2 Executive Decision-Making & Risk Modeling Takeaways
To guide executive decision-making, legislative advocacy, and regulatory risk management, executive leadership should align operational planning around two primary governance scenarios:
- Scenario A: Unified Democratic Legislative Alignment (57%–64% Senate / 79% House)
- Strategic Dynamics: Represents the primary baseline scenario (57%–64% conditional probability). House Democrats secure ~238 seats alongside a narrow 50-to-52 seat Democratic Senate majority.
- Nomination Velocity: Executive and judicial nominations move at maximum velocity through the Senate, eliminating confirmation bottlenecks for administrative agencies and federal courts.
- Legislative Risk Vectors: Expect aggressive utilization of Budget Reconciliation to pass revenue-raising legislation, tax reform targeting corporate provisions, and expanded environmental, social, and labor compliance mandates.
- Regulatory Oversight & CRA Exposure: Prior administrative rules enacted under previous congressional cycles face heightened exposure to rollbacks or targeted statutory restrictions. Corporate risk models must audit compliance protocols in energy, financial services, and healthcare sectors to adapt to expanded regulatory enforcement.
- Scenario B: Divided Government / Republican Senate Retention with Democratic House (36%–43% Senate / 79% House)
- Strategic Dynamics: Occurs if localized turnout or survey errors favor Republicans in key Senate battlegrounds (Texas, Iowa, Maine, Kansas, Florida), enabling Republicans to retain 50–52 Senate seats while Democrats assume the House majority (21% overall joint probability).
- Investigatory Friction & Subpoena Power: House committee chairs gain unilateral subpoena power. Corporate leadership must prepare for aggressive oversight investigations, public committee hearings, and corporate compliance scrutiny focused on environmental metrics, pricing structures, and labor practices.
- Nomination Gatekeeping: A Republican Senate majority functions as a strict gatekeeper for executive appointments, stalling judicial confirmations and creating prolonged vacancies across regulatory agencies.
- Fiscal Friction & Shutdown Risks: Statutory funding battles, Continuing Resolutions (CRs), and debt ceiling negotiations will produce severe fiscal gridlock. Legislative breakthroughs become rare, forcing the Executive Branch to pivot toward administrative rulemaking, executive orders, and agency enforcement actions to advance policy priorities.
- Sensitivity Analysis & Operational Directives for Risk Strategists
- Capital Allocation Timing: Executive teams should execute capital allocation strategies and lobby resource deployments based on early committee assignment signals during the post-election transition period, particularly within House committees overseeing tax policy, energy regulation, and financial services.
- Dual-Track Preparation: Because the Senate remains highly sensitive to a 3-to-7 seat shift under standard polling error bounds, corporate governance frameworks must maintain operational flexibility for both unified Democratic legislative action and divided-government legislative gridlock.
=================================================================
Demystifying Political Forecasting: How Pollsters Measure Elections and Predict Majorities
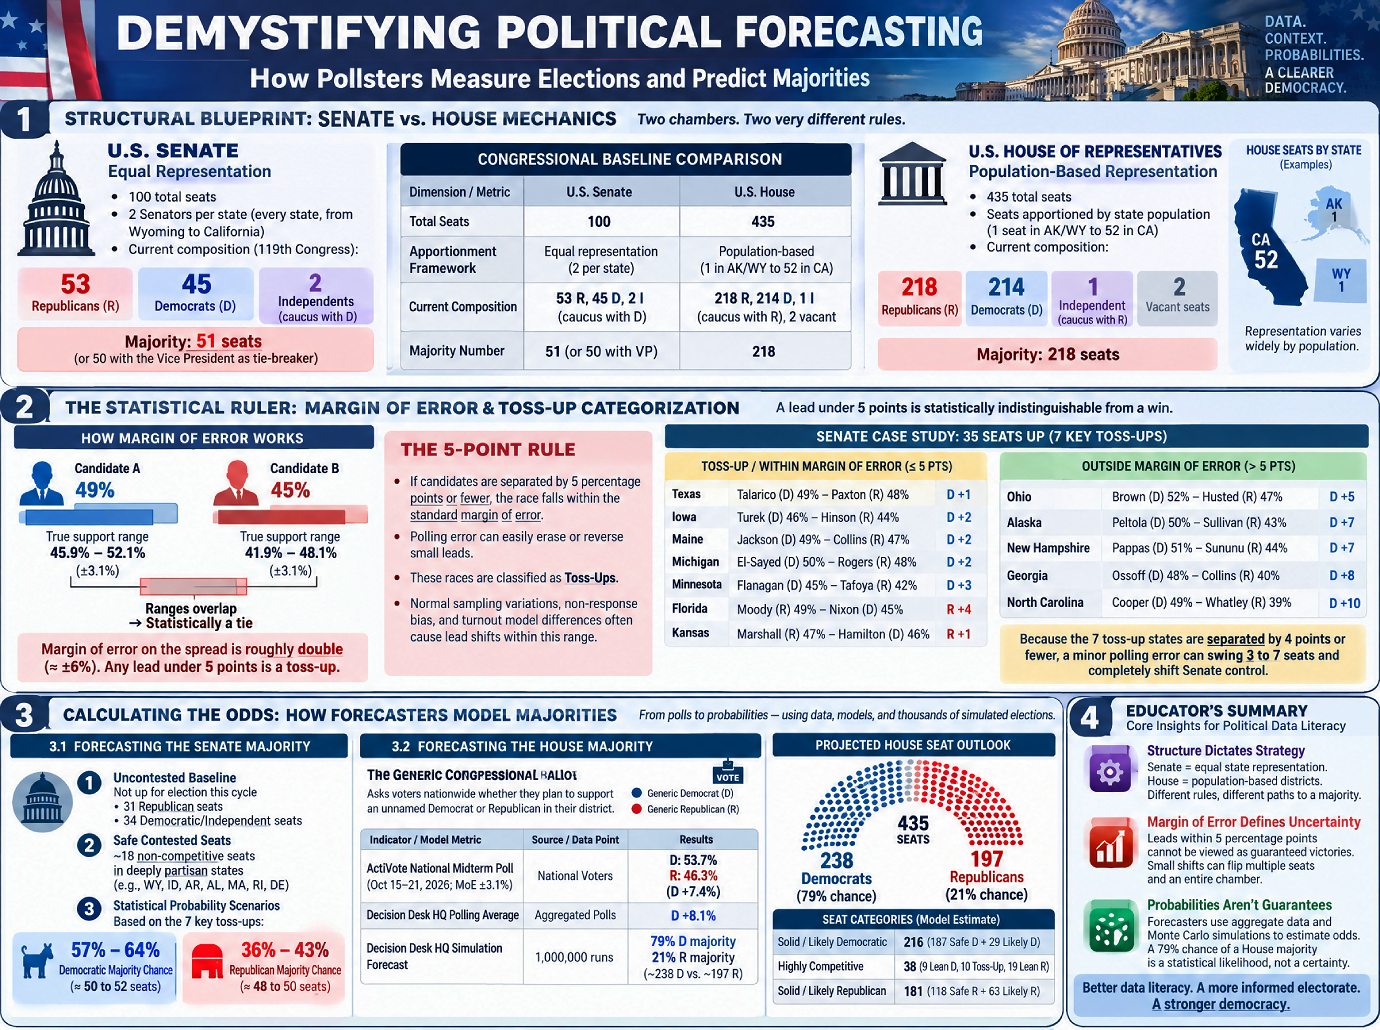
Demystifying Political Forecasting: How Pollsters Measure Elections and Predict Majorities
1. Structural Blueprint: Senate vs. House Mechanics
1.1 Electoral Framework & Current Composition
To evaluate how political analysts forecast election outcomes, one must first examine the constitutional architecture of the United States Congress. The legislative branch is divided into two distinct bodies—the U.S. Senate and the U.S. House of Representatives—each governed by entirely different structural rules for representation, apportionment, and establishing majorities.
The U.S. Senate is built upon the principle of equal state representation. Every state, regardless of geographic size or population density, is awarded exactly 2 Senators, creating a 100-member chamber. In the 119th Congress, the baseline party balance stands at 53 Republicans (R), 45 Democrats (D), and 2 Independents (I) who caucus with the Democrats. To secure a working majority, a political party needs 51 seats (or 50 seats if their party holds the Vice Presidency, which provides the tie-breaking vote).
In contrast, the U.S. House of Representatives utilizes population-based apportionment across a fixed total of 435 voting seats. Representation varies significantly across state lines: single-district states such as Wyoming and Alaska hold 1 at-large seat, whereas highly populated states like California hold up to 52 seats. The current overall composition of the House stands at 218 Republicans, 214 Democrats, 1 Independent caucusing with Republicans, and 2 vacant seats. To control the House, a party must reach a “magic number” of 218 seats.
Congressional Baseline Comparison
| Dimension / Metric | Chamber Comparison (Senate vs. House) |
|---|---|
| Chamber Framework & Apportionment | Senate: 100 total seats; equal representation (2 Senators per state, from Wyoming to California). House: 435 total seats; population-based apportionment (ranging from 1 seat in AK/WY to 52 seats in CA). |
| Current Party Composition | Senate: 53 Republicans, 45 Democrats, 2 Independents (caucusing with Democrats). House: 218 Republicans, 214 Democrats, 1 Independent (caucusing with Republicans), 2 Vacant seats. |
| Magic Number for Majority | Senate: 51 seats (or 50 seats with the Vice President as tie-breaker). House: 218 seats. |
Understanding these baseline chamber rules and starting seat totals provides the essential foundation for political analysts to evaluate individual election polls and quantify how localized candidate leads translate into national legislative majorities.
2. The Statistical Ruler: Margin of Error (MoE) & Toss-Up Categorization
2.1 Understanding the 5-Point Rule
When analyzing public opinion surveys, data journalists and forecasters rely on the statistical margin of error (MoE) to determine whether a candidate’s lead represents a genuine advantage or structural noise. In political polling, any contest where the leading and trailing candidates are separated by 5 percentage points or fewer is classified as falling within the standard margin of error.
Key Pedagogical Concept: Margin of Error on the Spread Students often assume that if a poll carries a reported margin of error of $\pm 3.1\%$, a candidate leading by 4 points ($49\%$ to $45\%$) is safely ahead. However, survey uncertainty applies to both candidates’ vote shares independently. If Candidate A’s true support lies between $45.9\%$ and $52.1\%$, and Candidate B’s true support lies between $41.9\%$ and $48.1\%$, their confidence intervals overlap substantially. Mathematically, the margin of error on the spread (the difference between the candidates) is roughly double the single-candidate error margin ($\approx \pm 6\%$). Consequently, any lead under 5 points is statistically indistinguishable from a tie.
Because standard sampling variations on Election Day can easily erase or reverse a minor lead, races within this 5-point window are designated as “Toss-Ups.” Normal polling error—arising from non-response bias or turnout model variations—frequently causes lead shifts between opposing candidates within this statistical buffer.
2.2 Senate Case Study: Sorting Contested Races
In the current election cycle, 35 Senate seats are up for contestation (33 regular Class II seats plus 2 special elections). While many seats reside in non-competitive states, applying the 5-point margin-of-error rule allows political analysts to sort key competitive races into distinct analytical categories:
- Toss-Up / Within Margin of Error (Lead $\le$ 5 Points):
- Texas: James Talarico (D) 49% vs. Ken Paxton (R) 48% (Emerson College: D +1); tied at 49% to 49% (Fox News: Tied / 0 pts).
- Iowa: Josh Turek (D) 46% vs. Ashley Hinson (R) 44% (Cook: D +2).
- Maine: Troy Jackson (D) 49% vs. Susan Collins (R) 47% (Suffolk University: D +2).
- Michigan: Abdul El-Sayed (D) 50% vs. Mike Rogers (R) 48% (Marist University: D +2).
- Minnesota: Peggy Flanagan (D) 45% vs. Michele Tafoya (R) 42% (KSTP / SurveyUSA: D +3).
- Florida: Ashley Moody (R) 49% vs. Angie Nixon (D) 45% (Univ. of North Florida: R +4).
- Kansas: Roger Marshall (R) 47% vs. Adam Hamilton (D) 46% (New York Times / Siena: R +1).
- Outside Margin of Error (Lead > 5 Points):
- Ohio: Sherrod Brown (D) 52% vs. Jon Husted (R) 47% (Fox News: D +5, sitting directly on the statistical boundary).
- Alaska: Mary Peltola (D) 50% vs. Dan Sullivan (R) 43% (New York Times / Siena, 50+ age cohort: D +7).
- New Hampshire: Chris Pappas (D) 51% vs. John Sununu (R) 44% (St. Anselm College: D +7).
- Georgia: Jon Ossoff (D) 48% vs. Mike Collins (R) 40% (Atlanta Journal-Constitution: D +8).
- North Carolina: Roy Cooper (D) 49% vs. Michael Whatley (R) 39% (Public polling: D +10).
The “So What?” Insight: Because polling margins across the 7 primary toss-up states (Texas, Iowa, Maine, Michigan, Minnesota, Florida, and Kansas) are separated by 4 points or fewer, they sit entirely within the margin of error. A standard, minor polling error in either direction across these states on Election Day can swing anywhere from 3 to 7 seats, completely shifting chamber control from one party to the other.
Once individual election contests are categorized by their statistical margin of error, forecasters can aggregate these localized probabilities to project which party holds the mathematical advantage in capturing an overall chamber majority.
3. Calculating the Odds: How Forecasters Model Majorities
3.1 Forecasting the Senate Majority
To determine the mathematical probability of a party capturing the Senate majority, forecasters construct models that aggregate uncontested baseline seats, safe partisan contests, and probabilistic toss-up simulations.
- Uncontested Baseline: A core set of seats is not up for election this cycle. Republicans hold 31 baseline seats, while Democrats and Independents hold 34 baseline seats.
- Safe Contested Seats: Of the 35 contested seats, approximately 18 non-competitive seats in deeply partisan states (e.g., Wyoming, Idaho, Arkansas, Alabama, Massachusetts, Rhode Island, and Delaware) carry negligible risk of flipping.
- Statistical Probability Scenarios: Assuming the 7 key toss-up states split evenly or follow standard midterm trends, political forecasters calculate the following chamber probabilities:
- Democratic Senate Majority: Projected at a 57% to 64% probability, translating to an expected baseline of 50 to 52 seats.
- Republican Senate Majority: Projected at a 36% to 43% probability, translating to an expected baseline of 48 to 50 seats.
3.2 Forecasting the House Majority: The Generic Ballot & District Models
Forecasting the U.S. House of Representatives presents a distinct methodological challenge. Because localized survey data does not exist for every single one of the 435 individual congressional districts, polling organizations evaluate national sentiment using the Generic Congressional Ballot. This metric asks voters nationwide whether they plan to support an unnamed generic Democrat or generic Republican in their local district.
Key Pedagogical Concept: Generic Ballot & Monte Carlo Simulations
- Generic Congressional Ballot: A macro-level polling metric used as a proxy for national party preference when district-level polling is unavailable.
- Monte Carlo Simulation: A computational technique where a model runs hundreds of thousands or millions of hypothetical election days (e.g., 1,000,000 runs by Decision Desk HQ). The model introduces randomized, correlated polling errors across all 435 districts to test how often each party surpasses the 218-seat threshold under varying polling shifts.
Forecasters aggregate generic ballot polling, district demographics, fundraising metrics, and historical voting behavior into these large-scale statistical simulations.
U.S. House Electoral Indicators
| Indicator / Model Metric | Source / Data Point | Statistical Spread & Findings |
|---|---|---|
| ActiVote National Midterm Poll (Oct 15–21, 2026; MoE ±3.1%) | Survey of National Voters | Generic Democrat (D): 53.7% Generic Republican (R): 46.3% (Margin: D +7.4% — Outside MoE) |
| Decision Desk HQ Polling Average | Aggregated Polling Data | Generic Democrat (D) +8.1% lead |
| Decision Desk HQ Simulation Forecast | 1,000,000 Statistical Runs | 79% Democratic Majority Chance 21% Republican Majority Chance (Projected: ~238 D seats vs. ~197 R seats) |
Statistical Insight: House vs. Senate Divergence
Across all 435 House seats, probabilistic modeling categorizes 216 seats as Solid/Likely Democratic (187 Safe D + 29 Likely D), 181 seats as Solid/Likely Republican (118 Safe R + 63 Likely R), and 38 seats as Highly Competitive (9 Lean D, 10 Pure Toss-Up, 19 Lean R).
A critical question for political data analysts is why the House and Senate forecasts diverge. Because the Democratic party’s lead in the national generic ballot (+7.4% to +8.1%) sits comfortably outside the typical ±3% to ±5% survey margin of error, simulation models grant Democrats a high 4-in-5 statistical likelihood (79%) of winning control of the House. A national lead of this magnitude creates a systemic wave that lifts candidate performance across dozens of suburban and swing districts simultaneously.
By contrast, the Senate remains significantly tighter (a near toss-up) because Senate control hinges on winning statewide multi-coalition contests in specific geographic footprints. With 7 key Senate races trapped inside the 5-point margin of error, localized candidate dynamics or a uniform polling error in just a few key states can easily alter chamber control, regardless of national popular sentiment.
By synthesizing structural rules, error margins, and simulation models, students of political data can establish clear, rigorous principles for evaluating election news and interpreting survey reports.
4. Educator’s Summary: Core Insights for Political Data Literacy
- Structure Dictates Strategy: The Senate’s equal state representation (2 per state) forces parties to win statewide, multi-coalition contests, whereas the House’s 435 population-apportioned seats make chamber control dependent on district demographics and broader national voter sentiment captured by the generic ballot.
- Margin of Error Defines Uncertainty: Polling leads within 5 percentage points cannot be viewed as guaranteed victories. Because sampling uncertainty applies to both candidates—doubling the margin of error on the spread—small percentage shifts across closely contested toss-up races can swing multiple seats and flip an entire chamber.
- Probabilities Aren’t Guarantees: Forecasters use aggregate data and Monte Carlo simulations (such as Decision Desk HQ’s 1,000,000-run model) to convert polling leads into percentage odds. While a generic ballot lead outside the margin of error gives Democrats a 79% probability of capturing the House, probabilities represent statistical likelihoods across simulations rather than deterministic guarantees.
========================================================
Executive Memorandum: Midterm Electoral Landscape and Legislative Power Dynamics
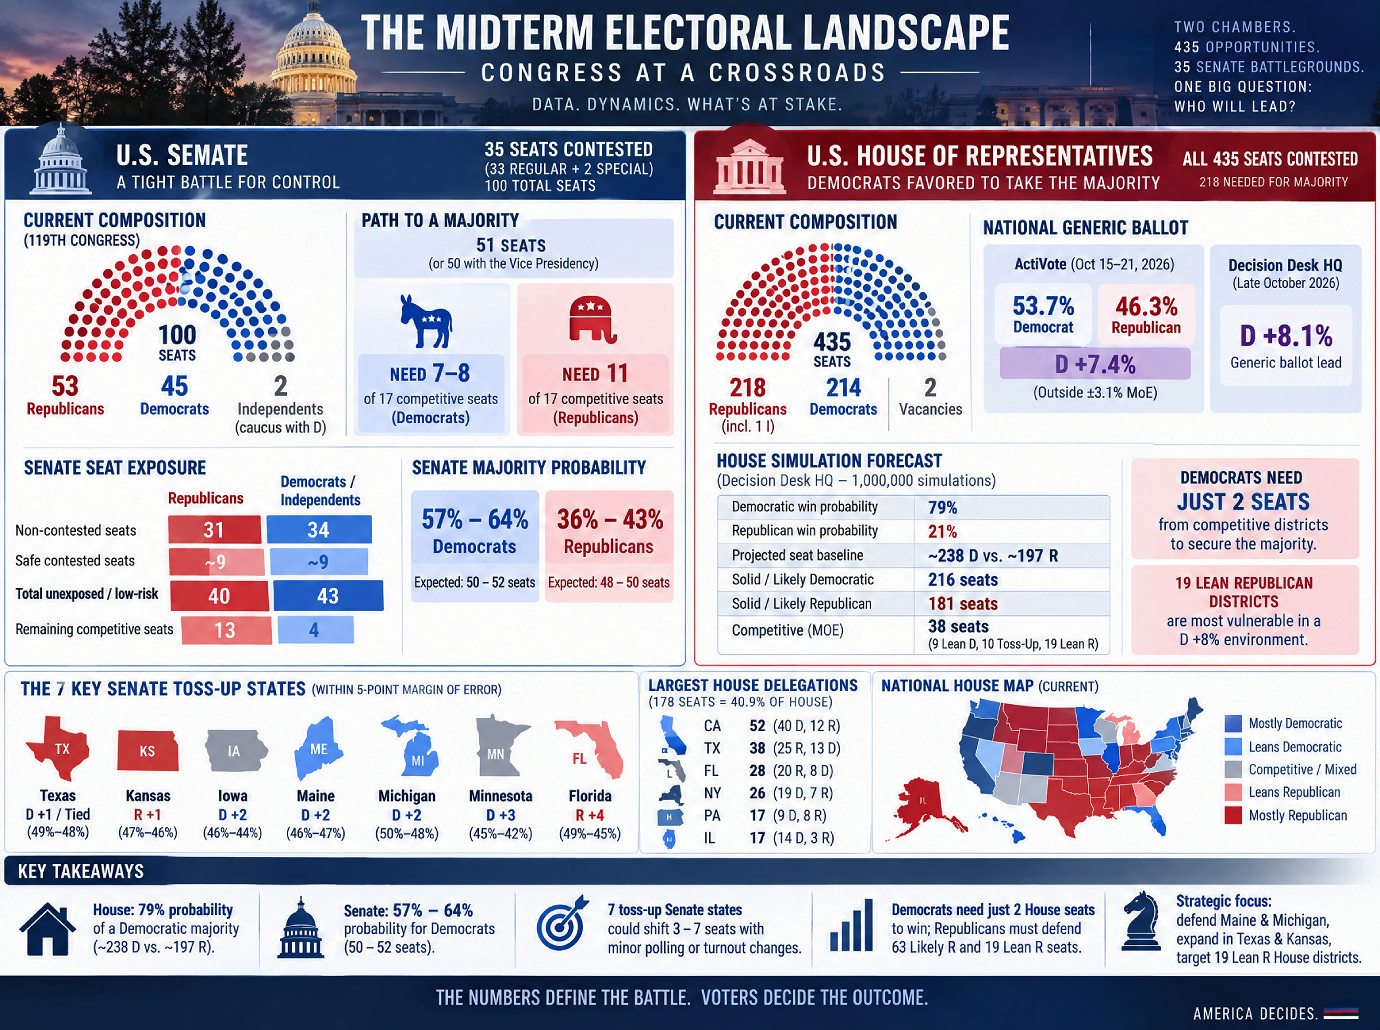
Executive Memorandum: Midterm Electoral Landscape and Legislative Power Dynamics
1. Baseline Chamber Architectures and Statistical Thresholds
The strategic battlefield for the upcoming midterm elections is governed by the underlying structural baselines of both houses of Congress. Operational control is dictated by pre-existing seat distribution, the proportion of unexposed or non-contested seats, and statutory majority requirements. From an analytical perspective, establishing these baseline parameters is essential for evaluating how party committees and political action funds must allocate limited capital. While the entire House of Representatives is subject to biennial re-election—exposing all 435 seats to national preference shifts—the Senate’s staggered Class II structure isolates operational risk to a fraction of its total membership. These structural limits define the mathematical boundaries within which stochastic variance, turnout sensitivity, and campaign efficiency operate.
Chamber Composition Analysis
In the baseline configuration of the 119th Congress, the Senate operates under a narrow party distribution consisting of 53 Republicans (R), 45 Democrats (D), and 2 Independents (I) who caucus with the Democrats. To secure operational control of the chamber, a party must reach a statutory threshold of 51 seats, or 50 seats if that party holds the Vice Presidency (exercising the constitutional tie-breaking vote).
The baseline composition of the House of Representatives reflects an extremely tight operational environment:
- Republicans: 218 seats
- Democrats: 214 seats
- Independents: 1 seat (caucusing with Republicans)
- Vacancies: 2 seats
The statutory majority threshold to exercise operational control in the House of Representatives is strictly 218 seats out of the 435 voting members.
Baseline Exposure Evaluation
Table 1.1: Senate Baseline Exposure & Unexposed Seat Distribution
| Chamber Exposure Category | Republican (R) Baseline | Democratic / Independent (D/I) Baseline | Operational Total / Threshold |
|---|---|---|---|
| Non-Contested Baseline Seats | 31 seats | 34 seats | 65 non-contested seats |
| Safe / Non-Competitive Contested Seats | ~9 seats (WY, ID, AR, AL) | ~9 seats (MA, RI, DE) | 18 safe contested seats |
| Total Unexposed / Low-Risk Seats | 40 seats | 43 seats | 83 non-exposed seats |
| Remaining Competitive Exposure | 13 seats | 4 seats | 17 target seats |
Table 1.2: House Baseline Composition & Statutory Thresholds
| Chamber Component | Baseline Seats | Operational Control Threshold |
|---|---|---|
| Republican Caucus | 218 seats (218 R + 1 R-caucusing I) | 218 seats |
| Democratic Caucus | 214 seats | 218 seats |
| Vacancies | 2 seats | N/A |
Strategic Impact Assessment & Marginal Path Analysis
Baseline exposure in the Senate generates an asymmetric defensive burden across party lines. Because Republicans hold 31 non-contested seats while Democrats and caucusing Independents hold 34, the initial structural floor gives the Democratic caucus a minor baseline advantage toward the 50- or 51-seat majority threshold. Furthermore, out of the 35 Senate seats contested in this cycle (33 regular Class II seats plus 2 special elections), 18 reside in deeply partisan jurisdictions—such as Wyoming, Idaho, Arkansas, and Alabama for Republicans, alongside Massachusetts, Rhode Island, and Delaware for Democrats—where the probability of a seat flip is negligible.
This underlying seat distribution creates a clear asymmetric conversion bottleneck:
- Democratic Path: Combining 34 non-contested seats with ~9 safe contested seats establishes an unexposed baseline of 43 seats. Consequently, the Democratic caucus needs to secure only 7 to 8 seats out of the remaining 17 competitive battlegrounds to achieve operational control (50 seats with the Vice Presidency or 51 outright).
- Republican Path: Starting from an unexposed baseline of 40 seats (31 non-contested + ~9 safe contested), Republicans must win 11 out of the 17 competitive contests to retain a 51-seat majority.
This mathematical disparity forces Republican leadership to defend a broader array of exposed territories, whereas Democratic strategists can concentrate financial and operational capital on a narrower set of conversion targets. Bridging these baseline architectural limits to state-level polling dynamics requires a granular examination of margin-of-error elasticity vectors across individual Senate contests.
2. U.S. Senate Dynamics: Polling Analysis and Probability Modeling
Evaluating the 35 contested Senate seats requires a rigorous quantitative framework that incorporates statewide survey variations, differential voter mobilization, and margin-of-error (MOE) sensitivity. The competitive field comprises 33 regular Class II contests alongside 2 special elections. In statewide elections, tracking candidate spreads against survey margins of error allows analysts to isolate volatile toss-up contests from races where localized leads sit beyond normal statistical noise.
Contested Race Synthesis
Table 2.1: Comprehensive Synthesis of Competitive U.S. Senate Contests
| State | Candidates & Party Affiliations | Latest Polling Percentages | Polling Source / Entity | Margin / Spread |
|---|---|---|---|---|
| Texas | James Talarico (D) vs. Ken Paxton (R) | 49% vs. 48% 49% vs. 49% | Emerson College Fox News | D +1 Tied (0) |
| Ohio | Sherrod Brown (D) vs. Jon Husted (R) | 52% vs. 47% | Fox News | D +5 |
| North Carolina | Roy Cooper (D) vs. Michael Whatley (R) | 49% vs. 39% | Public polling lead | D +10 |
| Georgia | Jon Ossoff (D) vs. Mike Collins (R) | 48% vs. 40% | Atlanta Journal-Constitution | D +8 |
| Michigan | Abdul El-Sayed (D) vs. Mike Rogers (R) | 50% vs. 48% | Marist University | D +2 |
| Iowa | Josh Turek (D) vs. Ashley Hinson (R) | 46% vs. 44% | Cook | D +2 |
| Maine | Troy Jackson (D) vs. Susan Collins (R) | 49% vs. 47% | Suffolk University | D +2 |
| Florida | Ashley Moody (R) vs. Angie Nixon (D) | 49% vs. 45% | Univ. of North Florida | R +4 |
| Minnesota | Peggy Flanagan (D) vs. Michele Tafoya (R) | 45% vs. 42% | KSTP / SurveyUSA | D +3 |
| New Hampshire | Chris Pappas (D) vs. John Sununu (R) | 51% vs. 44% | St. Anselm College | D +7 |
| Kansas | Roger Marshall (R) vs. Adam Hamilton (D) | 47% vs. 46% | New York Times / Siena | R +1 |
| Alaska | Mary Peltola (D) vs. Dan Sullivan (R) | 50% vs. 43% (50+ age cohort) | New York Times / Siena | D +7 |
Margin of Error (MOE) & Qualitative Sensitivity Analysis
Categorizing contests by statistical significance using a strict 5-point margin-of-error threshold separates the field into two operational domains:
Toss-Up / Within Margin of Error ($\le$ 5 Points)
- Texas: Talarico (D) +1 (49% vs. 48%) / Tied (49% vs. 49%)
- Kansas: Marshall (R) +1 (47% vs. 46%)
- Iowa: Turek (D) +2 (46% vs. 44%)
- Maine: Jackson (D) +2 (49% vs. 47%)
- Michigan: El-Sayed (D) +2 (50% vs. 48%)
- Minnesota: Flanagan (D) +3 (45% vs. 42%)
- Florida: Moody (R) +4 (49% vs. 45%)
Outside Margin of Error (> 5 Points)
- Ohio: Brown (D) +5 (52% vs. 47%) (positioned directly on the statistical boundary)
- New Hampshire: Pappas (D) +7 (51% vs. 44%)
- Alaska: Peltola (D) +7 (50% vs. 43%) (sampled specifically within the 50+ age cohort)
- Georgia: Ossoff (D) +8 (48% vs. 40%)
- North Carolina: Cooper (D) +10 (49% vs. 39%)
Qualitative Strategic Dynamics
- Expansion Battlegrounds (Texas & Kansas): Tight margins in Texas (Talarico D +1 / Tied) and Kansas (Marshall R +1) represent strategic expansion zones for Democrats. By maintaining competitive positions in these traditionally conservative states, Democrats force national Republican committees to divert defensive capital away from core toss-up states.
- Incumbent-Protection Battlegrounds (Maine & Michigan): Maine (Jackson D 49% vs. Collins R 47%) and Michigan (El-Sayed D 50% vs. Rogers R 48%) represent vital holding zones. In Maine, challenging an established incumbent requires sustained defensive resource allocation to preserve a narrow +2 point margin.
- Demographic Survey Qualifiers (Alaska): The reported 7-point lead for Peltola (D 50% vs. Sullivan R 43%) carries a key sampling caveat: it reflects public opinion specifically within the 50+ age cohort. Because older demographics demonstrate higher, more reliable voting propensity, this metric suggests strong foundational stability for Democrats, though the broader electorate remains subject to dynamic turnout shifts.
The strategic volatility of the Senate turns on the 7 primary toss-up states. Because candidate spreads in these races remain under 5 percentage points, a systematic polling error or turnout shift on Election Day would move between 3 and 7 net seats between party caucuses.
Probability Modeling & Majority Forecasts
Table 2.2: Stochastic Model Senate Majority Projections
| Outcome Projection | Majority Probability Range | Expected Seat Baseline | Key Driver Metrics |
|---|---|---|---|
| Democratic Senate Majority | 57% to 64% | 50 to 52 seats | Strong holding margins in ME/MI; competitive expansion in TX/KS; non-contested floor (34 seats). |
| Republican Senate Majority | 36% to 43% | 48 to 50 seats | Defensive moat in FL (+4); flip potential across 7 MOE toss-ups requiring 11/17 competitive conversions. |
The primary statistical engine allowing Democrats to maintain a favorable probability profile—despite starting from a 47-seat minority baseline in the 119th Congress model—is their structural positioning across expansion targets like Texas and Kansas, paired with narrow leads across defensive holding zones in the Midwest and Northeast.
While statewide Senate contests exhibit localized volatility, evaluating national House dynamics requires analyzing generic ballot metrics and multi-district delegation balances.
3. U.S. House of Representatives Analysis: Apportionment and Generic Ballot Forecasting
Unlike U.S. Senate elections, which turn on statewide media markets and individual candidate profiles, control of the House of Representatives is governed by district apportionment, partisan sorting, and national preference waves. Assessing individual polls across all 435 district contests is unfeasible, as the majority of seats are geographically insulated. Consequently, statistical forecasting models rely on national generic ballot tracking, district-level demographic elasticity, and multi-district delegation balances.
State Delegation Apportionment Breakdown
The 435 voting seats in the House of Representatives are apportioned among the 50 states according to population, ranging from single at-large districts to 52 districts in California.
Table 3.1: 50-State House Delegation Apportionment and Party Balance
| State | Total House Seats | Current Delegation Party Balance |
|---|---|---|
| Alabama | 7 | 6 R, 1 D |
| Alaska | 1 (At-large) | 1 R (Nicholas Begich) |
| Arizona | 9 | 6 R, 3 D |
| Arkansas | 4 | 4 R |
| California | 52 | 40 D, 12 R |
| Colorado | 8 | 5 D, 3 R |
| Connecticut | 5 | 5 D |
| Delaware | 1 (At-large) | 1 D |
| Florida | 28 | 20 R, 8 D |
| Georgia | 14 | 9 R, 5 D |
| Hawaii | 2 | 2 D |
| Idaho | 2 | 2 R |
| Illinois | 17 | 14 D, 3 R |
| Indiana | 9 | 7 R, 2 D |
| Iowa | 4 | 4 R |
| Kansas | 4 | 3 R, 1 D |
| Kentucky | 6 | 5 R, 1 D |
| Louisiana | 6 | 5 R, 1 D |
| Maine | 2 | 2 D |
| Maryland | 8 | 7 D, 1 R |
| Massachusetts | 9 | 9 D |
| Michigan | 13 | 7 D, 6 R |
| Minnesota | 8 | 4 D, 4 R |
| Mississippi | 4 | 3 R, 1 D |
| Missouri | 8 | 6 R, 2 D |
| Montana | 2 | 2 R |
| Nebraska | 3 | 3 R |
| Nevada | 4 | 3 D, 1 R |
| New Hampshire | 2 | 2 D |
| New Jersey | 12 | 9 D, 3 R |
| New Mexico | 3 | 3 D |
| New York | 26 | 19 D, 7 R |
| North Carolina | 14 | 10 R, 4 D |
| North Dakota | 1 (At-large) | 1 R |
| Ohio | 15 | 10 R, 5 D |
| Oklahoma | 5 | 5 R |
| Oregon | 6 | 4 D, 2 R |
| Pennsylvania | 17 | 9 D, 8 R |
| Rhode Island | 2 | 2 D |
| South Carolina | 7 | 6 R, 1 D |
| South Dakota | 1 (At-large) | 1 R |
| Tennessee | 9 | 8 R, 1 D |
| Texas | 38 | 25 R, 13 D |
| Utah | 4 | 4 R |
| Vermont | 1 (At-large) | 1 D |
| Virginia | 11 | 6 D, 5 R |
| Washington | 10 | 8 D, 2 R |
| West Virginia | 2 | 2 R |
| Wisconsin | 8 | 6 R, 2 D |
| Wyoming | 1 (At-large) | 1 R |
High-Leverage Delegation Centers
The six largest state delegations account for 178 of the 435 total House seats (40.9% of the chamber):
- California (52 seats: 40 D, 12 R): Represents the largest Democratic defensive baseline and high-leverage target environment in suburban markets.
- Texas (38 seats: 25 R, 13 D): Core Republican structural anchor, containing fast-growing suburban battlegrounds.
- Florida (28 seats: 20 R, 8 D): Consolidated Republican majority delegation with limited competitive exposure.
- New York (26 seats: 19 D, 7 R): Key battlefield state where suburban swing districts directly influence national majority thresholds.
- Pennsylvania (17 seats: 9 D, 8 R): Highly balanced delegation serving as a micro-index of national preference shifts.
- Illinois (17 seats: 14 D, 3 R): Anchors Democratic strength across the industrial Midwest.
National Generic Congressional Ballot Metrics
National public opinion regarding control of the House of Representatives is evaluated through the Generic Congressional Ballot:
- ActiVote National Midterm Poll (Oct 15–21, 2026; MoE $\pm$3.1%):
- Generic Democrat: 53.7%
- Generic Republican: 46.3%
- Margin: D +7.4% (statistically significant; sits outside the $\pm$3.1% margin of error).
- Decision Desk HQ Polling Average (Late October 2026):
- Generic Democrat Lead: +8.1 points.
Historically, when an opposition party’s national generic ballot lead expands past +7 percentage points, it correlates with major net seat gains, providing sufficient wave momentum to overcome localized incumbency advantages.
Decision Desk HQ 1,000,000 Simulation Forecast
Aggregating generic ballot tracking, district demographics, fundraising differentials, and historical midterm voting patterns, the Decision Desk HQ House Model (1,000,000 statistical simulations across all 435 seats) yields the following structural forecast:
Table 3.2: House Simulation Forecast and District Categorization
| Parameter / Category | Quantitative Value | Operational Interpretation |
|---|---|---|
| Democratic Win Probability | 79% | High-probability national wave environment. |
| Republican Win Probability | 21% | Low-probability defensive retention environment. |
| Projected Seat Baseline | ~238 D vs. ~197 R | Projected net shift of ~24 Democratic seats. |
| Solid / Likely Democratic | 216 seats | 187 Safe D + 29 Likely D (2 seats short of majority). |
| Solid / Likely Republican | 181 seats | 118 Safe R + 63 Likely R. |
| Competitive Battlefield (MOE) | 38 seats | 9 Lean D, 10 Pure Toss-Up, 19 Lean R. |
House Structural Seat Efficiency Analysis
The simulation model’s projection of a ~41-seat Democratic majority (~238 D vs. ~197 R) under an 8-point generic preference environment stems directly from structural seat efficiency:
- Low Conversion Threshold: Democrats enter the election with 216 seats categorized as Solid or Likely Democratic (187 Safe D + 29 Likely D). Because the statutory majority requirement is strictly 218 seats, Democrats need a net gain of only 2 seats from the competitive battlefield to secure operational control.
- Asymmetric Target Volatility: Of the 38 highly competitive battleground seats, 19 are categorized as “Lean Republican.” In a national generic wave environment of D +7.4% to +8.1%, these 19 Lean Republican districts experience disproportionate voter preference erosion. Because the Democratic baseline sits near the 218-seat threshold, modest uniform national shifts destabilize these 19 districts, transforming small national preference gains into asymmetrical seat flips.
Connecting House simulation metrics to statewide Senate trajectories provides the foundation for an executive evaluation of legislative power shifts.
4. Strategic Implications for Congressional Power Shifts
The quantitative evidence outlines a asymmetric structural landscape across the two chambers of Congress. The divergence between the House of Representatives (a high-probability Democratic flip) and the Senate (a highly volatile toss-up environment) will shape post-election legislative power dynamics, executive oversight, and capital allocation.
Cross-Chamber Dynamic Comparison
+-----------------------------------------------------------------------------------+| CROSS-CHAMBER DYNAMIC COMPARISON |+---------------------------------------------------+-------------------------------+| CHAMBER METRIC | OPERATIONAL PROJECTION |+---------------------------------------------------+-------------------------------+| House Democratic Win Probability | 79% (High Probability Wave) || House Projected Seat Distribution | ~238 D vs. ~197 R || National Generic Preference Spread | D +7.4% to D +8.1% (Outside) |+---------------------------------------------------+-------------------------------+| Senate Democratic Majority Probability | 57% to 64% (Volatile Edge) || Senate Expected Seat Baseline | 50 to 52 D vs. 48 to 50 R || Senate Critical Path Volatility | 7 MOE Toss-Up States |+---------------------------------------------------+-------------------------------+
- The House Environment: Governed by national preference waves, the House reflects a predictable trajectory. A +7.4% to +8.1% national generic preference edge positions Democrats to win a 79% probability majority (~238 seats), driven by seat efficiency across 19 vulnerable Lean Republican districts.
- The Senate Environment: Governed by statewide candidate dynamics and regional elasticity, the Senate remains sensitive to minor polling movements. While Democrats hold a statistical edge (57% to 64% probability; 50 to 52 seats), operational control depends on 7 toss-up contests within the 5-point margin of error. A minor polling shift or turnout variance would adjust the chamber balance by 3 to 7 seats, moving final control between 48 and 52 seats.
Executive Risk Summary
- House Control Trajectory: Democrats hold a 79% statistical probability of capturing the House majority, driven by national generic ballot indicators (+7.4% ActiVote, +8.1% DDHQ) operating outside standard survey error bounds.
- Senate Control Trajectory: Democratic probability of securing operational Senate control sits between 57% and 64% (expected outcome: 50 to 52 seats), while Republican retention probability sits between 36% and 43% (expected outcome: 48 to 50 seats).
- Margin of Error Sensitivity: 7 critical Senate contests (Texas, Kansas, Iowa, Maine, Michigan, Minnesota, and Florida) remain within the 5-point survey margin of error. A 2-to-3 point systematic error shifts 3 to 7 seats on Election Day.
- Conversion Asymmetry: Democrats require only 2 additional seats beyond their 216 Solid/Likely House baseline to lock in a majority, while Republicans must defend 63 Likely R and 19 Lean R seats under an 8-point national preference headwind.
Strategic Directives for Resource Allocation
1. Senate Defensive Moats
- Priority Target Areas: Maine (Jackson D +2) and Michigan (El-Sayed D +2).
- Action Directive: Campaign directors must lock in financial liquidity and ground-game infrastructure in these incumbent-protection zones. Because these seats anchor the 43-seat unexposed baseline, maintaining these narrow leads is required to keep the conversion threshold at 7–8 seats rather than expanding it to an unviable 9–10 seats.
2. Senate Offensive Reallocation
- Priority Target Areas: Texas (Talarico D +1 / Tied) and Kansas (Marshall R +1).
- Action Directive: Reallocate independent expenditure funds into Texas and Kansas. Pushing these expansion battlegrounds forces national Republican organizations to spend defensives in high-cost media markets, reducing their capacity to contest Midwest toss-ups like Iowa (Turek D +2) and Minnesota (Flanagan D +3).
3. House Generic Blitz Tactics
- Priority Target Areas: The 19 “Lean Republican” and 10 “Pure Toss-Up” districts.
- Action Directive: Deploy centralized voter contact and field mobilization campaigns directly into the 19 Lean Republican districts. Because Democrats hold 216 Solid/Likely seats and face an +8-point national generic tailwind, concentrating field resources in these specific districts will maximize wave-conversion efficiency and secure the 218-seat majority threshold early on Election Night.
Concluding Summary
Operational priorities must align with these statistical realities. The House represents a high-probability wave environment where capital should be deployed to convert the 19 Lean Republican seats into active flips. Conversely, the Senate remains a tight, high-stakes battleground where majorities turn on thin margins across 7 toss-up states. Maintaining strategic liquidity across those 7 statewide contests remains the primary operational requirement for securing full legislative control in the upcoming midterms.
Various Analysis Infographics