


Phillipston MA History and Community Profile
The Town of Phillipston MA History and Community Profile
Listen to a “Deep Dive” podcast about Phillipston history on any device, CLICK PLAY.
Community Profile – A Snapshot of Phillipston, Massachusetts
HIstorical and Demographic Profile – Phillipston MA
Community Profile: Phillipston, Massachusetts
Community Profile: Phillipston, Massachusetts
1.0 Executive Overview and Historical Context
This profile provides a foundational, data-driven overview of Phillipston, Massachusetts, intended to support strategic municipal planning, development initiatives, and grant application processes. By synthesizing key geographic, demographic, socioeconomic, and civic data, this document serves as a comprehensive reference for understanding the town’s current composition and historical trajectory.
Phillipston at a Glance
| Attribute | Data |
|---|---|
| County | Worcester |
| 2020 Population | 1,724 |
| Total Area | 24.6 sq mi (63.8 km²) |
| Land Area | 24.3 sq mi (62.8 km²) |
| Water Area | 0.4 sq mi (1.0 km²) |
| Elevation | 1,165 ft (355 m) |
| Website | www.phillipston-ma.gov |
Historical Milestones
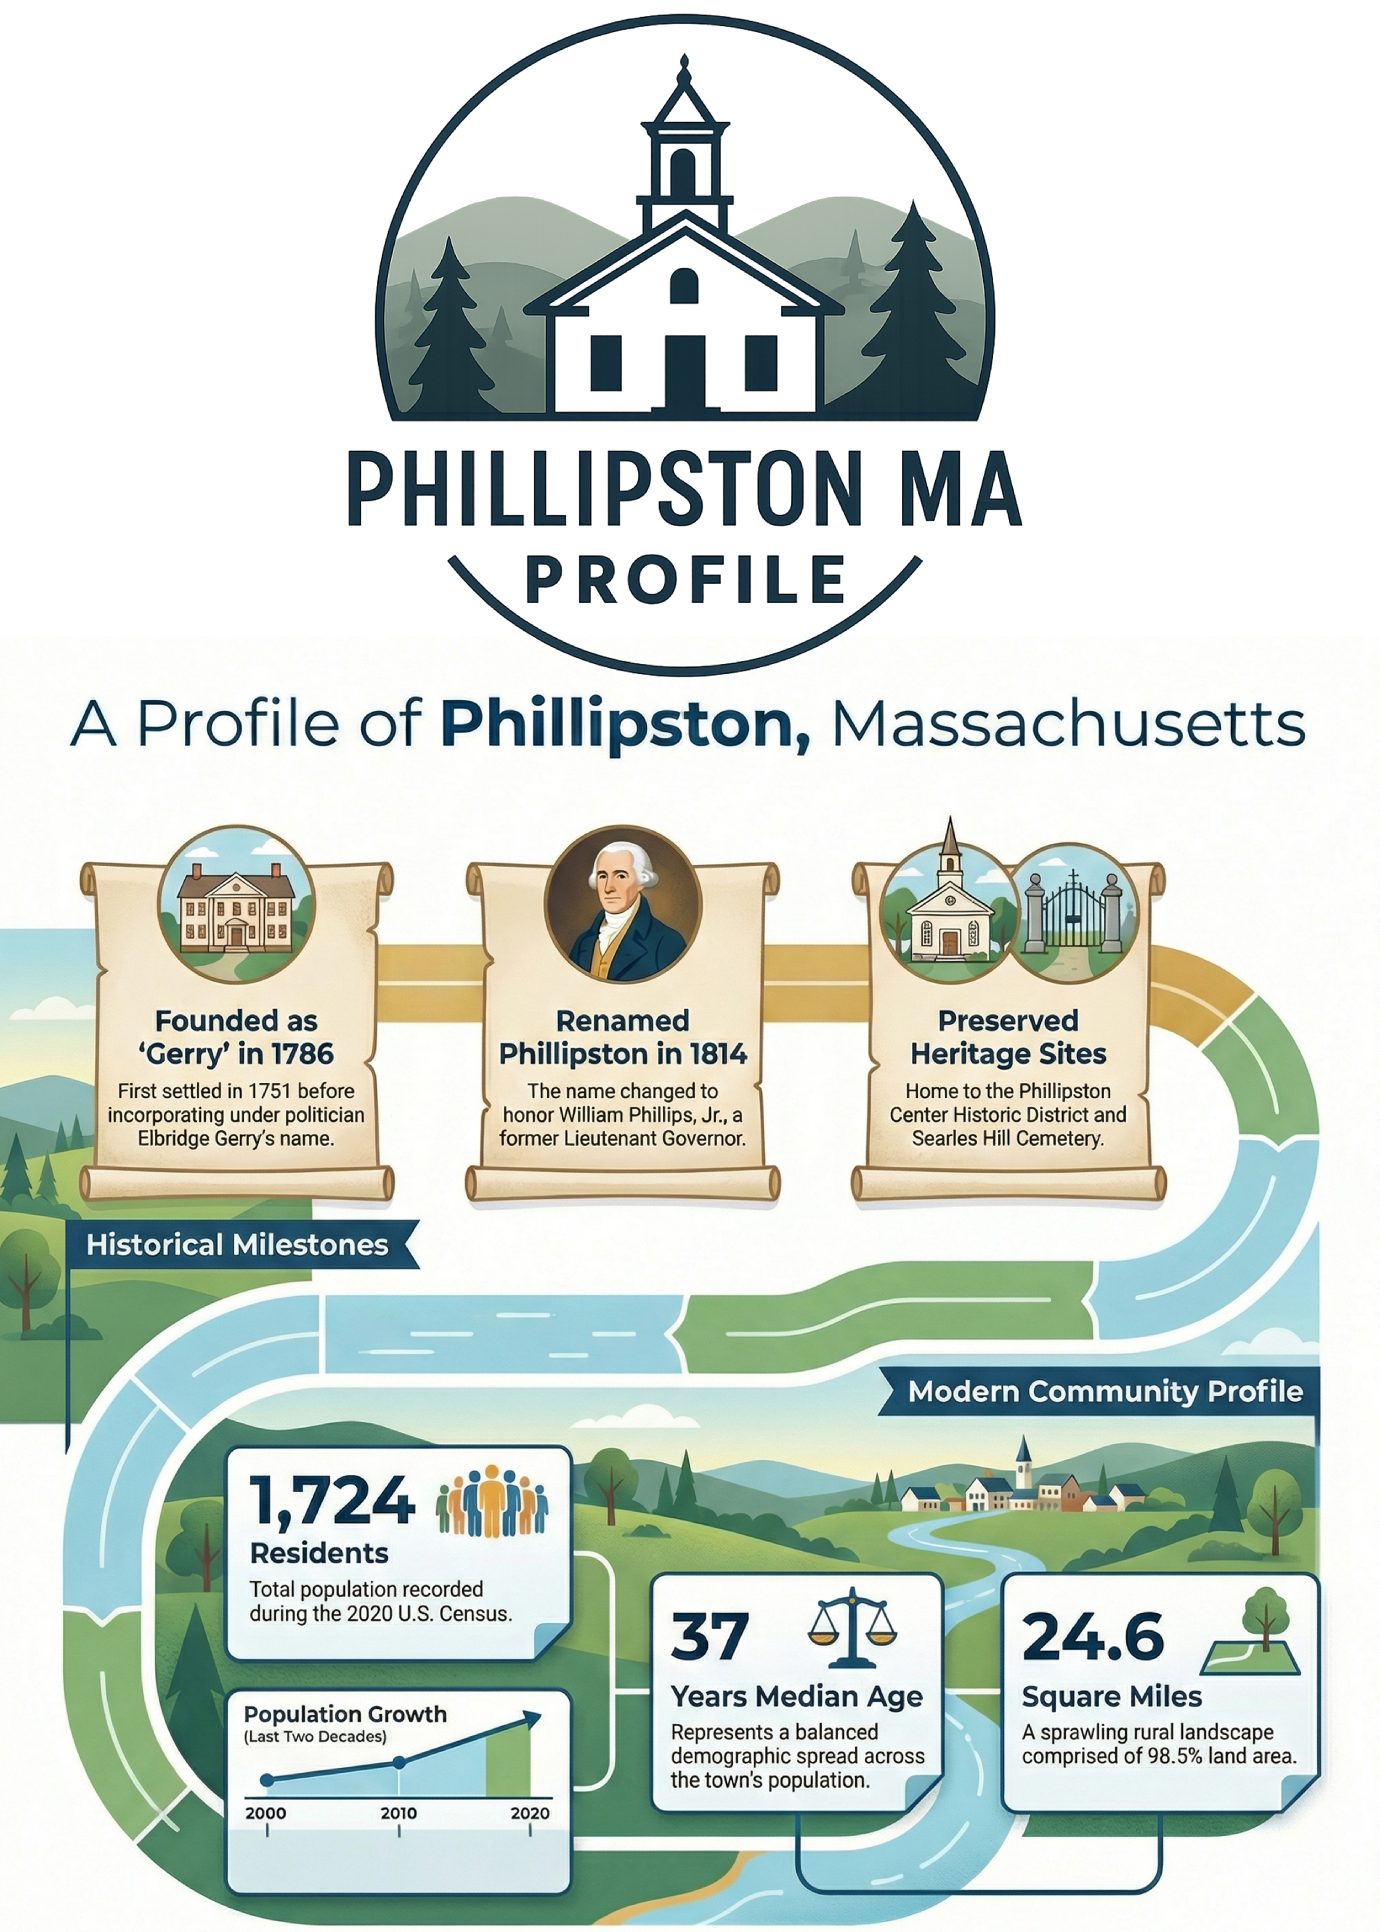
Phillipston’s history dates back to its first settlement in 1751. On October 20, 1786, after separating from the neighboring town of Templeton, it was officially incorporated as the town of Gerry, named in honor of politician Elbridge Gerry. The name was later changed to Phillipston on February 5, 1814, to honor William Phillips, Jr., who served as the tenth Lieutenant Governor of Massachusetts.
The town’s historical significance is preserved in two sites designated on the National Register of Historic Places:
• The Phillipston Center Historic District (designated 1999)
• Searles Hill Cemetery (designated 2011)
This historical foundation provides context for the town’s physical setting, which is detailed in the following section.
2.0 Geographic and Physical Characteristics
A clear understanding of a town’s geography is essential for effective planning related to land use, regional cooperation, and infrastructure development. Phillipston’s location and physical resources define its character and influence its strategic opportunities.
2.1 Location and Regional Context
Phillipston is a town located in Worcester County, Massachusetts. It shares borders with several surrounding municipalities, placing it within a distinct regional cluster. Its bordering communities are:
• Royalston (to the north)
• Athol (to the northwest)
• Templeton (to the east)
• Hubbardston (to the southeast)
• Petersham (to the southwest)
• Barre (a small portion to the south)
2.2 Land and Water Resources
According to the United States Census Bureau, the town has a total area of 24.6 square miles (63.8 km²). This area is composed of:
• Land: 24.3 square miles (62.8 km²)
• Water: 0.4 square miles (1.0 km²), which accounts for 1.54% of the town’s total area.
The town’s physical space provides the setting for the population that inhabits it, whose characteristics are explored next.
3.0 Demographic Analysis
Demographic data is a critical tool for forecasting community needs, allocating public resources, and planning for essential services such as education, public safety, and elder care. This section analyzes Phillipston’s population trends and composition.
3.1 Historical Population Trends
The following table documents Phillipston’s population from 1850 through the most recent estimate for 2022, revealing a dynamic history of change.
| Year | Population |
|---|---|
| 1850 | 809 |
| 1860 | 764 |
| 1870 | 693 |
| 1880 | 621 |
| 1890 | 502 |
| 1900 | 441 |
| 1910 | 426 |
| 1920 | 354 |
| 1930 | 357 |
| 1940 | 481 |
| 1950 | 638 |
| 1960 | 695 |
| 1970 | 872 |
| 1980 | 953 |
| 1990 | 1,485 |
| 2000 | 1,621 |
| 2010 | 1,682 |
| 2020 | 1,724 |
| 2022* | 1,720 |
| *population estimate |
The data reveals a period of significant population decline from 1850 to 1920, when the town’s population reached its lowest recorded point. This trend reversed in the subsequent decades, with steady recovery and growth. A particularly notable period of growth occurred leading up to the 1990 census, which recorded a 55.8% increase over the previous decade. This sharp increase, likely reflecting broader suburbanization trends in Massachusetts, fundamentally reshaped the town’s demographic profile and service demands over a short period. Since then, the population has continued to grow at a more moderate pace.
3.2 Population Composition
While the most recent total population count is from the 2020 census, the most detailed demographic breakdown available is from the 2000 U.S. Census. As of 2020, Phillipston’s population was 1,724, with a population density of 71.1 inhabitants per square mile.
The 2000 census provides the following detailed characteristics:
• Racial Makeup (2000): The town was predominantly White (97.72%), with other groups including African American (0.37%), Native American (0.12%), Asian (0.37%), and individuals identifying with two or more races (1.42%). Hispanic or Latino of any race constituted 0.43% of the population.
• Age Distribution (2000):
◦ Under 18: 29.2%
◦ 18 to 24: 5.2%
◦ 25 to 44: 33.3%
◦ 45 to 64: 24.7%
◦ 65 and older: 7.5%
• Median Age (2000): The median age in the town was 37 years.
• Gender Ratio (2000): Overall, there were 101.1 males for every 100 females. For the population aged 18 and over, this ratio increased to 106.7 males for every 100 females.
3.3 Household and Family Characteristics (2000 Census)
Data from the 2000 census offers a snapshot of household and family structures within the community.
• There were a total of 580 households and 443 families.
• 39.5% of households had children under the age of 18.
• 63.8% of households were married couples living together.
• The average household size was 2.79, and the average family size was 3.19.
This demographic profile directly informs the socioeconomic conditions of the community, which are outlined in the next section.
4.0 Socioeconomic Profile (2000 Census Data)
Socioeconomic indicators are critical for identifying community needs, understanding the local economic health, and targeting development efforts to improve residents’ quality of life. All data in this section is derived from the 2000 U.S. Census. Crucially, this 20-plus-year-old data serves only as a historical baseline and should not be used for current programmatic decisions or grant applications without sourcing more recent data, such as from the U.S. Census Bureau’s American Community Survey.
4.1 Income and Earnings
The 2000 census reported the following key income metrics for Phillipston:
• Median Household Income: $46,845
• Median Family Income: $52,011
• Per Capita Income: $18,706
• Male vs. Female Median Income: A significant disparity existed, with a median income of $39,231 for males compared to $25,625 for females.
4.2 Poverty Status
Based on 2000 data, approximately 3.8% of families and 5.8% of the total population were living below the poverty line. The data further breaks down poverty levels by age group:
• Under age 18: 8.5% were below the poverty line.
• Age 65 or over: 4.0% were below the poverty line.
The town’s socioeconomic fabric is managed and supported by its system of governance and its public service infrastructure.
5.0 Governance and Civic Infrastructure
A town’s governance structure and civic institutions form the framework through which community services are delivered, public policy is set, and strategic goals are executed.
5.1 Municipal Government
Phillipston operates under an Open Town Meeting form of government. The town’s primary administrative contact is the Administrative Assistant, Susan Varney.
5.2 State and Federal Representation
Phillipston is represented by the following elected officials at the state and federal levels:
| Office | Name | Party |
|---|---|---|
| State Representative | Susannah Whipps | Unenrolled |
| State Senator | Peter J. Durant | R |
| Governor’s Councilor | Paul DePalo | D |
| U.S. Representative | James P. McGovern (2nd District) | D |
| U.S. Senator | Elizabeth Warren | D |
| U.S. Senator | Ed Markey | D |
| Data verified as of October 2023. |
5.3 Public Education System
Phillipston is a member of the Narragansett Regional School District, which it shares with the town of Templeton. Following the closure of the Phillipston Memorial School, the educational path for students is as follows:
• Elementary School: Students attend Templeton Memorial School in Templeton.
• Middle School: Students attend Narragansett Regional Middle School.
• High School: Students attend Narragansett Regional High School.
For post-secondary education, the area is served by Mount Wachusett Community College.
5.4 Phillips Free Public Library
The Phillips Free Public Library, founded in 1860, is a key civic institution. An analysis of fiscal year 2008 data provides a snapshot of its municipal funding. In that year, the town of Phillipston allocated 1.08% of its budget, or $31,203, to the library. This expenditure amounted to approximately $17 per person.
This framework of governance and public services provides the foundation upon which the community operates and plans for its future.
6.0 Notable Persons and Conclusion
6.1 Notable Persons
Two notable individuals with historical ties to Phillipston are:
• Charlotte Barnum: a mathematician.
• Thomas H. White: an industrialist.
6.2 Key Insights for Strategic Planning
This profile synthesizes key data points to provide a comprehensive overview of Phillipston for municipal planning and development. The analysis reveals a small, rural town with a history of significant demographic shifts and a clear civic structure. The following takeaways are particularly relevant for strategic planning and grant applications:
• Leverage Stable Growth: The town’s century of sustained population growth indicates underlying stability. Planning initiatives should focus on identifying and enhancing the amenities that attract and retain residents to ensure this positive trend continues.
• Address Critical Data Gaps: The reliance on 2000 census data for household characteristics presents a significant planning risk. A primary initiative must be to acquire more current demographic data to ensure services for families, children, and seniors are aligned with present-day needs.
• Socioeconomic Equity: The historical data highlights a significant gender income gap within a community characterized by a high proportion of families. Future economic development strategies should consider initiatives that support workforce participation and pay equity to enhance overall household financial stability.
• Expand Regional Partnerships: The town’s successful participation in the Narragansett Regional School District provides a proven model for inter-municipal collaboration. This framework should be leveraged to explore further regional partnerships in public safety, economic development, or shared services to enhance efficiency and effectiveness.
• Utilize Civic Engagement Framework: The Open Town Meeting form of government offers a direct channel for resident participation. Strategic initiatives should proactively leverage this framework to build community consensus and ensure public buy-in for key development projects. —————
A Historical and Demographic Profile of Phillipston, Massachusetts
A Historical and Demographic Profile of Phillipston, Massachusetts
1.0 Introduction
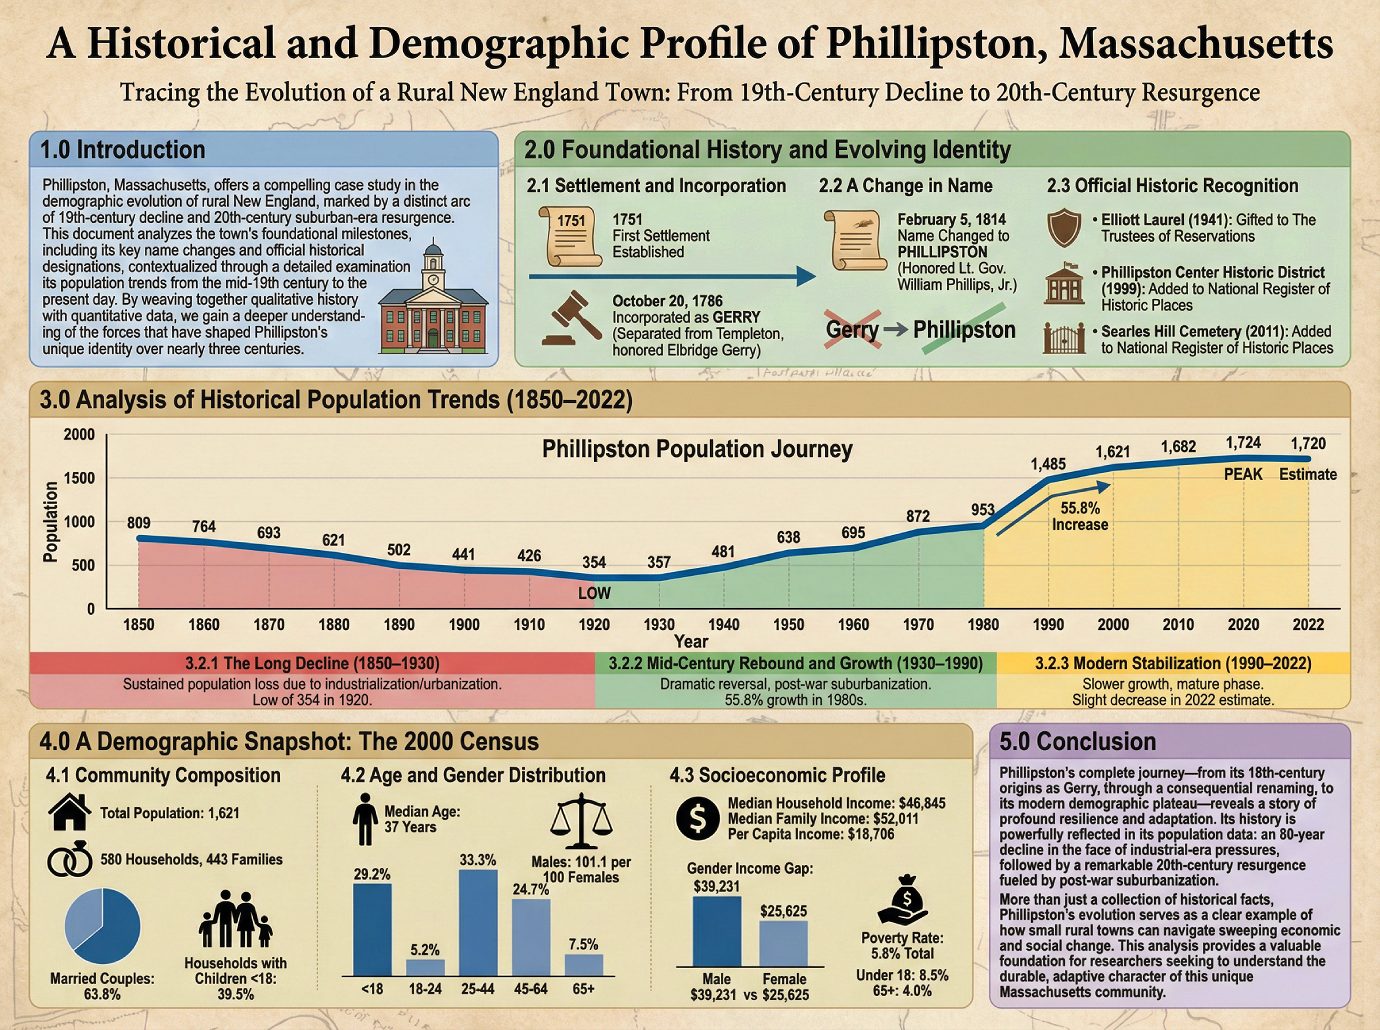
Phillipston, Massachusetts, offers a compelling case study in the demographic evolution of rural New England, marked by a distinct arc of 19th-century decline and 20th-century suburban-era resurgence. To provide a comprehensive historical narrative for researchers, this document analyzes the town’s foundational milestones, including its key name changes and official historical designations. This history is further contextualized through a detailed examination of its population trends, tracing the demographic journey of its residents from the mid-19th century to the present day. By weaving together qualitative history with quantitative data, we gain a deeper understanding of the forces that have shaped Phillipston’s unique identity over nearly three centuries.
2.0 Foundational History and Evolving Identity
Understanding a town’s origins is critical to appreciating its development. The initial settlement, the act of incorporation, and even the choice of a name are foundational elements that establish a community’s long-term identity and character. In Phillipston, these early decisions and subsequent changes tell a story of a town forging its own path.
2.1 Settlement and Incorporation
The history of Phillipston begins in the mid-18th century, with the first settlement established in 1751. The town was officially formed by separating from the neighboring town of Templeton. On October 20, 1786, it was formally incorporated under its original name, Gerry, in honor of the prominent Massachusetts politician Elbridge Gerry.
2.2 A Change in Name
A pivotal event in the town’s narrative occurred nearly three decades after its incorporation. On February 5, 1814, the name was officially changed from Gerry to Phillipston. This change was made to honor William Phillips, Jr., who was serving as the tenth Lieutenant Governor of Massachusetts. This renaming represents a significant shift in the town’s identity, aligning it with a new influential figure and marking a distinct chapter in its civic history.
2.3 Official Historic Recognition
Over the centuries, Phillipston’s historical significance has been formally codified through several key designations that preserve its heritage for future generations. These milestones include:
• Elliott Laurel (1941): This notable property was gifted to The Trustees of Reservations, ensuring its preservation.
• Phillipston Center Historic District (1999): The town’s historic center was added to the National Register of Historic Places.
• Searles Hill Cemetery (2011): This historic burial ground was added to the National Register of Historic Places, acknowledging its cultural and historical importance.
These historical milestones provide the narrative framework for the town’s history, which is further illuminated by the quantitative data illustrating its population’s journey over time.
3.0 Analysis of Historical Population Trends (1850-2022)
Demographic data offers a powerful quantitative lens through which to view a town’s history. Population shifts are not merely numbers; they often reflect broader economic, social, and regional forces at play. An analysis of Phillipston’s census records reveals distinct eras of decline, growth, and eventual stabilization, painting a vivid picture of its resilience and adaptation.
3.1 Historical Population Data Table
| Year | Population |
|---|---|
| 1850 | 809 |
| 1860 | 764 |
| 1870 | 693 |
| 1880 | 621 |
| 1890 | 502 |
| 1900 | 441 |
| 1910 | 426 |
| 1920 | 354 |
| 1930 | 357 |
| 1940 | 481 |
| 1950 | 638 |
| 1960 | 695 |
| 1970 | 872 |
| 1980 | 953 |
| 1990 | 1,485 |
| 2000 | 1,621 |
| 2010 | 1,682 |
| 2020 | 1,724 |
| 2022* | 1,720 |
2022 value is a population estimate.
3.2 Interpreting the Demographic Arc
The population data reveals a compelling demographic arc that can be divided into three distinct phases: a long period of decline, a mid-century rebound and period of rapid growth, and a recent era of stabilization.
3.2.1 The Long Decline (1850–1930)
For eighty years, from its recorded peak of 809 residents in 1850, Phillipston experienced a sustained and significant population loss. The town’s population steadily decreased through the late 19th and early 20th centuries, ultimately reaching a low of just 354 people in 1920—a decline of over 56%. This multi-generational trend suggests the town was subject to the powerful forces of industrialization and urbanization that drew residents away from rural agricultural communities toward larger economic centers.
3.2.2 Mid-Century Rebound and Growth (1930–1990)
The period beginning around 1930 marked a dramatic reversal of fortunes for Phillipston. The population began a consistent upward trend, accelerating significantly after World War II. This era of recovery was likely fueled by the expansion of the American highway system and the resulting suburban sprawl that made towns like Phillipston accessible commuter communities. The period culminated in the late 20th century, with the 1990 census recording a remarkable 55.8% population increase in a single decade, as the town grew from 953 residents in 1980 to 1,485 in 1990.
3.2.3 Modern Stabilization (1990–2022)
Following the explosive growth of the previous era, the period from 1990 to the present has been characterized by much slower growth and stabilization. The population increased modestly from 1,485 in 1990 to 1,724 in 2020. This trend suggests that Phillipston reached a mature phase in its demographic lifecycle, with its growth rate normalizing. However, the 2022 estimate of 1,720 residents marks a slight decrease from the 2020 census figure, an important nuance suggesting this mature phase may include minor fluctuations or even the beginning of a new, subtle trend.
These long-term trends set the stage for a more detailed look at the town’s composition at the turn of the 21st century.
4.0 A Demographic Snapshot: The 2000 Census
While long-term trends illustrate the town’s historical journey, a deep dive into a specific census year provides a rich, textured understanding of the community’s composition and socioeconomic character at a particular moment. The 2000 U.S. Census offers such a snapshot, revealing key details about the town’s family structures, age distribution, and economic standing at the turn of the century.
4.1 Community Composition
As of the 2000 census, Phillipston had a total population of 1,621 people, organized into 580 households and 443 families. The data highlights a community centered around traditional family structures. A significant majority of households, 63.8%, were composed of married couples living together. Furthermore, 39.5% of all households included children under the age of 18, indicating a strong presence of young families within the town.
4.2 Age and Gender Distribution
The town’s age profile in 2000 revealed a community in its prime working and family-rearing years. The median age was 37 years. While 29.2% of residents were under 18 and 7.5% were 65 or older, the core of the population was of working age. A full third of residents (33.3%) were in the 25 to 44 age bracket, with another 24.7% aged 45 to 64. Young adults aged 18 to 24 made up 5.2% of the population. The gender ratio was nearly balanced, with 101.1 males for every 100 females.
4.3 Socioeconomic Profile
The economic indicators from the 2000 census describe a middle-income community with notable internal disparities. The median household income was 46,845∗∗,andthemedianfamilyincomewashigherat∗∗52,011, with a per capita income of 18,706∗∗.Thedataalsorevealedasignificantgenderincomegap,withmalesreportingamedianincomeof∗∗39,231 versus $25,625 for females. While 5.8% of the total population was below the poverty line, this figure was not evenly distributed across age groups. Poverty disproportionately affected the town’s youngest residents, with 8.5% of those under age 18 living below the poverty line, compared to 4.0% of those age 65 and over.
This detailed snapshot from 2000 provides valuable context for the broader historical trends, leading to a synthesized conclusion about the town’s overall development.
5.0 Conclusion
Phillipston’s complete journey—from its 18th-century origins as Gerry, through a consequential renaming, to its modern demographic plateau—reveals a story of profound resilience and adaptation. Its history is powerfully reflected in its population data: an 80-year decline in the face of industrial-era pressures, followed by a remarkable 20th-century resurgence fueled by post-war suburbanization. More than just a collection of historical facts, Phillipston’s evolution serves as a clear example of how small rural towns can navigate sweeping economic and social change. This analysis provides a valuable foundation for researchers seeking to understand the durable, adaptive character of this unique Massachusetts community.
—————
Understanding Phillipston: A Demographic Snapshot
Understanding Phillipston: A Demographic Snapshot
Introduction: What Are Demographics and Why Do They Matter?
Welcome to a demographic exploration of Phillipston, Massachusetts. Think of demographics as the story of a town told through numbers. By looking at data about population, age, income, and households, we can build a detailed picture of a community’s character and composition. This document will break down the key demographic data for Phillipston to help you understand who lives there. The information presented is drawn from the U.S. Census, with the most recent total population from the 2020 census and more detailed characteristics from the 2000 census.
——————————————————————————–
1. Population and Density: How Many People Live in Phillipston?
1.1. The Big Number: Total Population
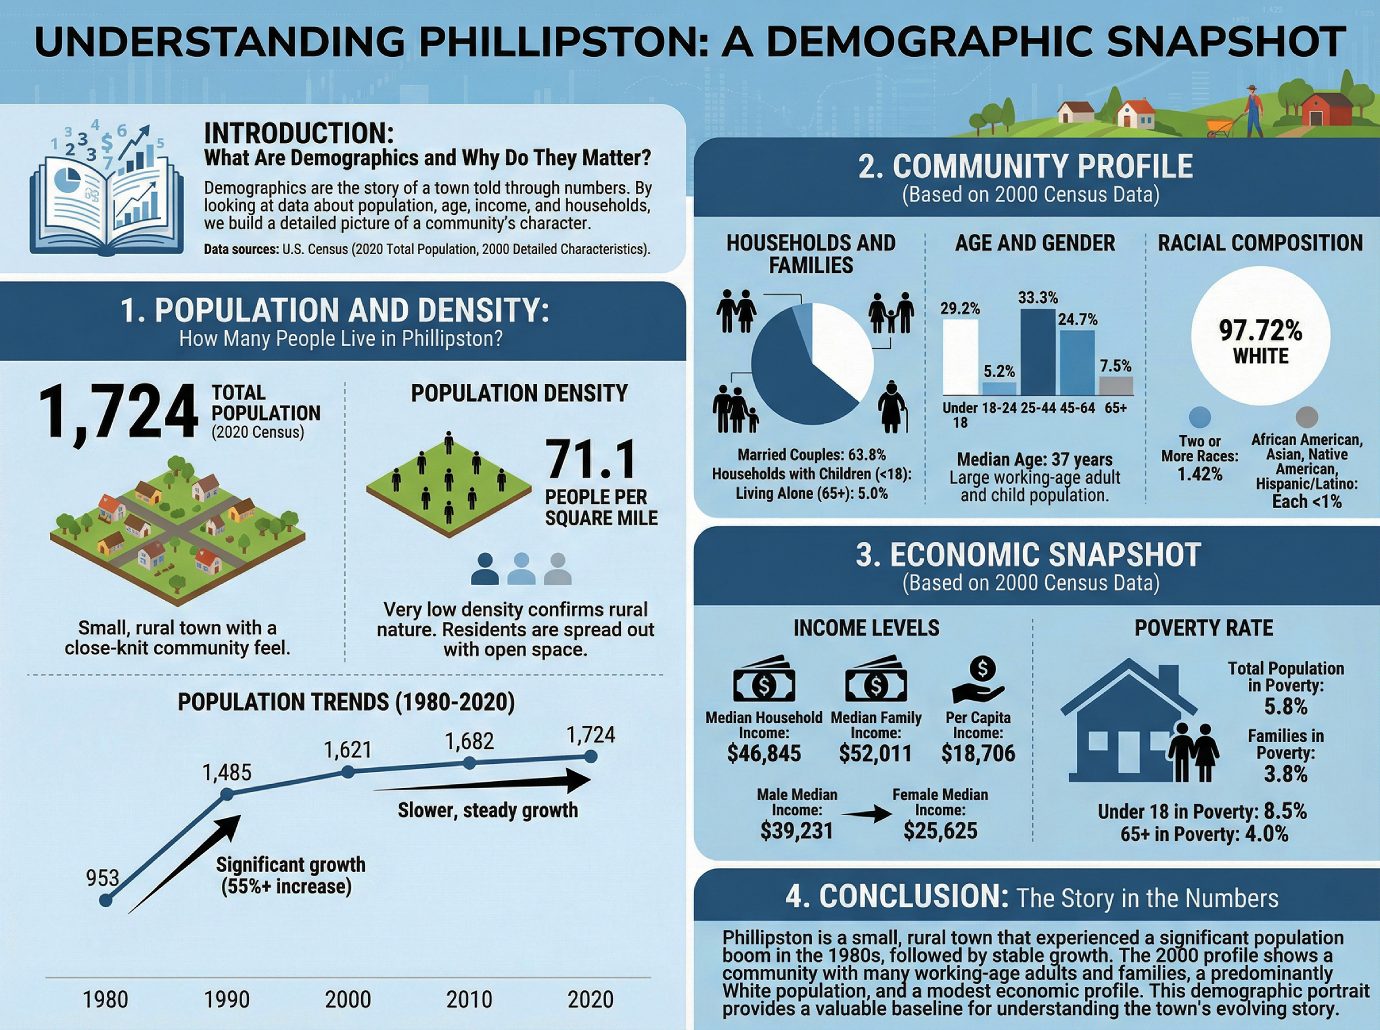
According to the 2020 census, the total population of Phillipston was 1,724 people. This number characterizes Phillipston as a small, rural town, a place with a close-knit community feel rather than a bustling urban center.
1.2. Population Density: How Spread Out Are Residents?
Population density is a measure of how crowded or spread out people are within a given area. It’s typically calculated as the number of people living per square mile.
Phillipston’s population density is 71.1 people per square mile.
This very low density figure confirms the town’s rural nature. It indicates that residents are quite spread out, with significant open space, woodlands, or farmland separating homes and neighborhoods.
1.3. A Look Back: Population Trends
Looking at historical data reveals how a town’s population has changed over time.
| Year | Population |
|---|---|
| 1980 | 953 |
| 1990 | 1,485 |
| 2000 | 1,621 |
| 2010 | 1,682 |
| 2020 | 1,724 |
The data shows a period of significant growth between 1980 and 1990, when the population increased by over 55%. Since 1990, the town has experienced slower, more steady growth, adding a few hundred residents over the past three decades.
Knowing how many people live in Phillipston is the first step; the next is understanding how they group themselves into households and families.
——————————————————————————–
2. Community Profile (Based on 2000 Census Data)
The following detailed statistics are from the U.S. Census of 2000 and provide a deeper look into the composition of the Phillipston community at that time.
2.1. Households and Families
It’s helpful to distinguish between a ‘household’ and a ‘family.’ A household includes all people who occupy a single housing unit, while a family is a specific type of household where residents are related by birth, marriage, or adoption.
• Married Couples: A strong majority of households, 63.8%, were married couples living together. This suggests a community with a traditional family structure as its foundation.
• Children in the Home: Nearly four in ten households (39.5%) had children under the age of 18 living with them, indicating a significant presence of young, growing families in the town.
• Living Alone: A small percentage of households (5.0%) consisted of someone 65 years of age or older living alone, pointing to a small but present independent senior population.
2.2. Age and Gender
The age distribution of a community reveals its life stage, from young families to retirees. In 2000, Phillipston’s population was spread out across the following age groups:
• Under 18: 29.2%
• 18 to 24: 5.2%
• 25 to 44: 33.3%
• 45 to 64: 24.7%
• 65 and older: 7.5%
These numbers show that in 2000, Phillipston had a large population of working-age adults (ages 25-44) and children under 18. The senior population (65 and older) was relatively small in comparison. The town’s median age was 37 years.
2.3. Racial Composition
The 2000 census data shows that the town’s population was predominantly White.
• The primary racial makeup was 97.72% White.
• The remaining portion of the population was composed of several smaller groups. Residents identifying as being of two or more races made up 1.42% of the population, while the African American, Asian, Native American, and Hispanic or Latino populations each constituted less than 1%.
This profile of the people who live in Phillipston provides a foundation for understanding the town’s economic landscape.
——————————————————————————–
3. Economic Snapshot (Based on 2000 Census Data)
These economic statistics, also from the U.S. Census of 2000, offer insights into the financial well-being of Phillipston’s residents at the turn of the century.
3.1. Income Levels
Several metrics are used to measure income, each providing a different perspective.
• Median Household Income: $46,845. This is the midpoint income for all households in the town, meaning half of the households earned more than this amount and half earned less.
• Median Family Income: $52,011. This figure focuses only on family households and is typically higher because it excludes single-person households, which often have lower incomes.
• Per Capita Income: $18,706. This figure represents the average income per person in the entire town. Because it includes non-working children and retirees in its calculation, it is often significantly lower than household or family income.
The data also revealed a significant gap between the median incomes of male and female residents at that time. Males had a median income of 39,231∗∗,whilefemaleshadamedianincomeof∗∗25,625.
3.2. Poverty Rate
The poverty line is an income threshold set by the federal government to determine who is considered to be living in poverty. In 2000, 5.8% of Phillipston’s total population and 3.8% of families were living below the poverty line.
When broken down by age, the data showed that 8.5% of residents under age 18 and 4.0% of those 65 or older were below the poverty line.
Together, these demographic and economic data points paint a detailed picture of the community.
——————————————————————————–
4. Conclusion: The Story in the Numbers
The demographic data provides a clear and insightful snapshot of Phillipston, Massachusetts. Based on the available census information, it emerges as a small, rural town that experienced a significant population boom in the 1980s, which then gave way to a period of more stable, gradual growth. This period of growth likely contributed to the community’s 2000 profile as a town with a significant population of working-age adults and a high percentage of households with children. At that time, Phillipston was characterized by a predominantly White population and a modest economic profile. It is important to remember that communities are always evolving; this demographic portrait provides a valuable baseline for understanding Phillipston’s story and how it may continue to change in the future. ———————
The Tiny Town That Changed Its Name: 3 Stories Hidden in Phillipston’s History
The Tiny Town That Changed Its Name: 3 Stories Hidden in Phillipston’s History
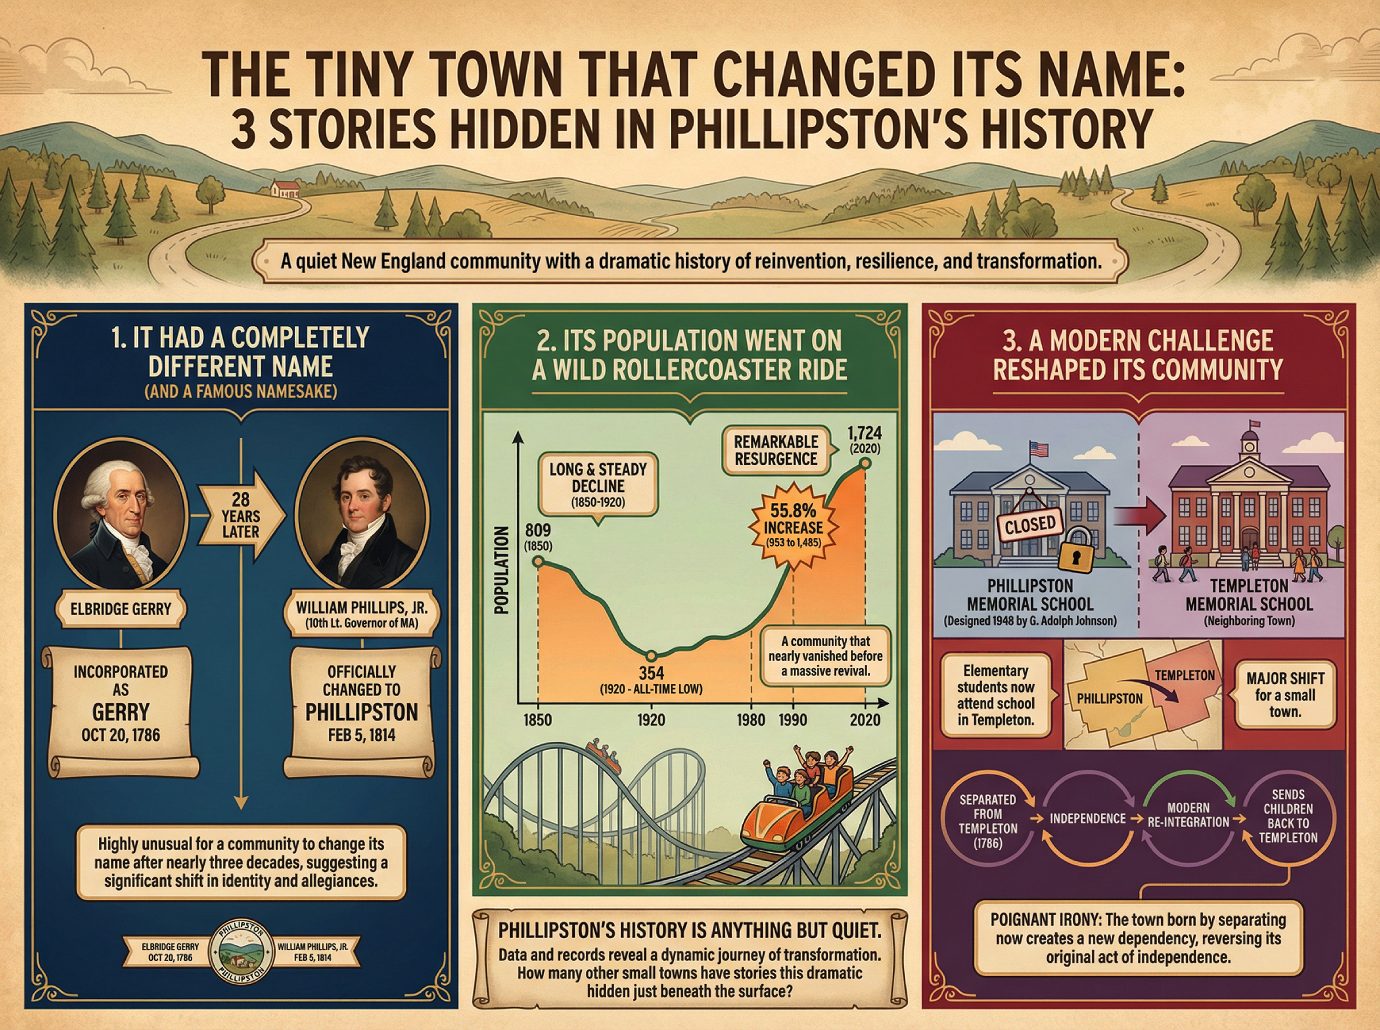
Have you ever driven through a quiet New England town and wondered about the stories hidden behind its historic facade? These seemingly sleepy communities often possess dramatic histories of change and resilience. The town of Phillipston, Massachusetts, is a perfect example, holding a fascinating story of reinvention just beneath the surface.
It Had a Completely Different Name (And a Famous Namesake)
When it was first incorporated on October 20, 1786, after separating from the neighboring town of Templeton, the community we now know as Phillipston was named Gerry. The name honored the prominent politician Elbridge Gerry. It wasn’t until nearly three decades later, on February 5, 1814, that the name was officially changed to Phillipston in honor of William Phillips, Jr., who served as the tenth Lieutenant Governor of Massachusetts. For a community to change its name after 28 years is highly unusual and suggests a significant shift in its identity and allegiances during its formative years.
Its Population Went on a Wild Rollercoaster Ride
The demographic history of Phillipston is one of extremes. In 1850, the town had a population of 809 residents. Over the next 70 years, however, it experienced a long and steady decline, hitting an all-time low of just 354 people in 1920.
This period of decline was followed by a remarkable resurgence. The most dramatic shift occurred between 1980 and 1990, when the population exploded from 953 to 1,485 residents—a stunning 55.8% increase in a single decade. This data paints a picture not of a static, unchanging village, but of a community that nearly vanished before experiencing a massive revival.
A Modern Challenge Reshaped Its Community
Even in recent years, the town has undergone profound change. The local public elementary school, the Phillipston Memorial School—designed in 1948 by the architect G. Adolph Johnson—was recently closed. As a result, elementary students from Phillipston now attend Templeton Memorial School in the neighboring town of Templeton.
For a small town with a 2020 population of only 1,724, the closure of a local school marks a major shift. But here, the story comes full circle with a poignant irony. The town born by separating from Templeton over two centuries ago now sends its children back, creating a new kind of dependency that reverses its original act of independence and speaks volumes about the evolution of small-town life.
From a complete name change to a dramatic population rollercoaster and a modern re-integration with its neighbor, Phillipston’s history is anything but quiet. Its story is a powerful reminder that data and historical records can reveal a dynamic journey of transformation. How many other small towns have stories this dramatic hidden just beneath the surface? —————–
A Snapshot of Phillipston, Massachusetts
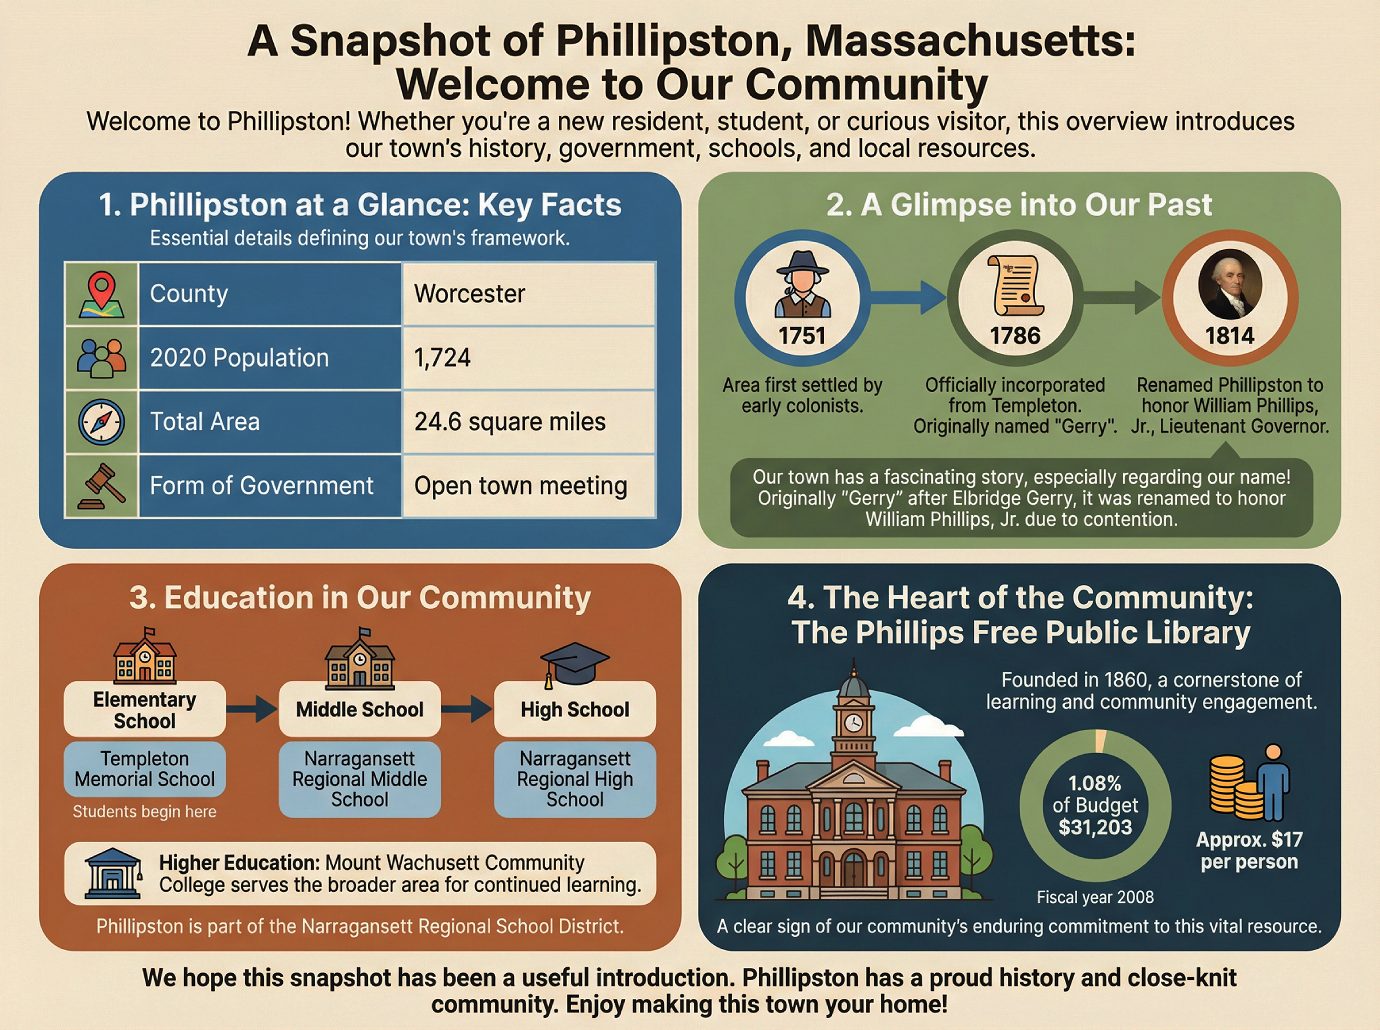
Welcome to Phillipston! Whether you’re a new resident, a student, or simply curious about our community, we’re glad you’re here. This brief overview is designed to give you a helpful introduction to our town’s history, government, schools, and local resources, providing a starting point for getting to know your new community.
1. Phillipston at a Glance: Key Facts
Here are a few essential details that define the basic framework of our town.
| Fact | Detail |
|---|---|
| County | Worcester |
| 2020 Population | 1,724 |
| Total Area | 24.6 square miles |
| Form of Government | Open town meeting |
But of course, a town is more than just statistics. Our story really begins with our founding and the unique history that gives Phillipston its character.
2. A Glimpse into Our Past
Our town has a fascinating story, especially when it comes to our name! Originally part of Templeton, we were first incorporated under the name “Gerry” to honor the politician Elbridge Gerry. However, the name proved to be a point of contention, and it wasn’t long before residents chose to rename the town after William Phillips, Jr., a respected lieutenant governor.
Here are some key milestones in our town’s formation:
• 1751: The area was first settled by early colonists.
• 1786: The town officially incorporated by separating from Templeton. It was originally named Gerry.
• 1814: The town’s name was changed to Phillipston to honor William Phillips, Jr., who served as the tenth Lieutenant Governor of Massachusetts.
This history provides the foundation for our modern community and its essential services, including our school system.
3. Education in Our Community
Phillipston is a member of the Narragansett Regional School District, which it shares with the neighboring town of Templeton. While we previously had our own Phillipston Memorial School, it recently closed, so our younger students now begin their education in Templeton. The educational journey for students in our town is as follows:
1. Elementary School: Students begin their education at Templeton Memorial School.
2. Middle School: Students then attend Narragansett Regional Middle School.
3. High School: Finally, students graduate from Narragansett Regional High School.
For higher education opportunities, Mount Wachusett Community College serves the broader area, offering a pathway for continued learning. This commitment to lifelong learning is also reflected in our wonderful public library.
4. The Heart of the Community: The Phillips Free Public Library
The Phillips Free Public Library stands as a cornerstone of learning and community engagement in Phillipston. Founded in 1860, it has a long and proud history of serving residents of all ages.
To give you an idea of how much our town has always valued its library, records from fiscal year 2008 show that Phillipston dedicated 1.08% of its budget, or $31,203, to its operations. That translated to approximately $17 per person that year, a clear sign of our community’s enduring commitment to this vital resource.
We hope this snapshot has been a useful and informative introduction to Phillipston. Our town has a proud history and a close-knit community, and we are delighted to have you here. There’s so much more to discover, and we hope you enjoy making this town your home.