Historic Blizzards – A Series of Gardner Magazine Reports

Jump to various sections on this page to view any of 6 reports. CLICK a LINK to go lower on the page:
Historical Analysis of Major U.S. Snowstorms and Blizzards —– The White Hurricane and the Birth of the Subway: How Extreme Winter Forced America to Rebuild —– Frozen in Time: A Chronological Journey Through America’s Greatest Winter Storms (1880–Present) —– The Winter Storm Severity Handbook: Understanding the Regional Snowfall Index (RSI) —– Historical Analysis of American Winter Disaster Management: Economic Impacts and Response Efficacy —–Resilience by Design: Historical Winter Weather Failures as Catalysts for Urban Adaptation —–
We have a Lengthy 42 minute podcast covering all bases of the Historic Blizzards in American History and its affect on the nation. Listen on any device, CLICK PLAY.
The short video summarizes Historic Blizzards:
Historical Analysis of Major U.S. Snowstorms and Blizzards
Historical Analysis of Major U.S. Snowstorms and Blizzards
Summary
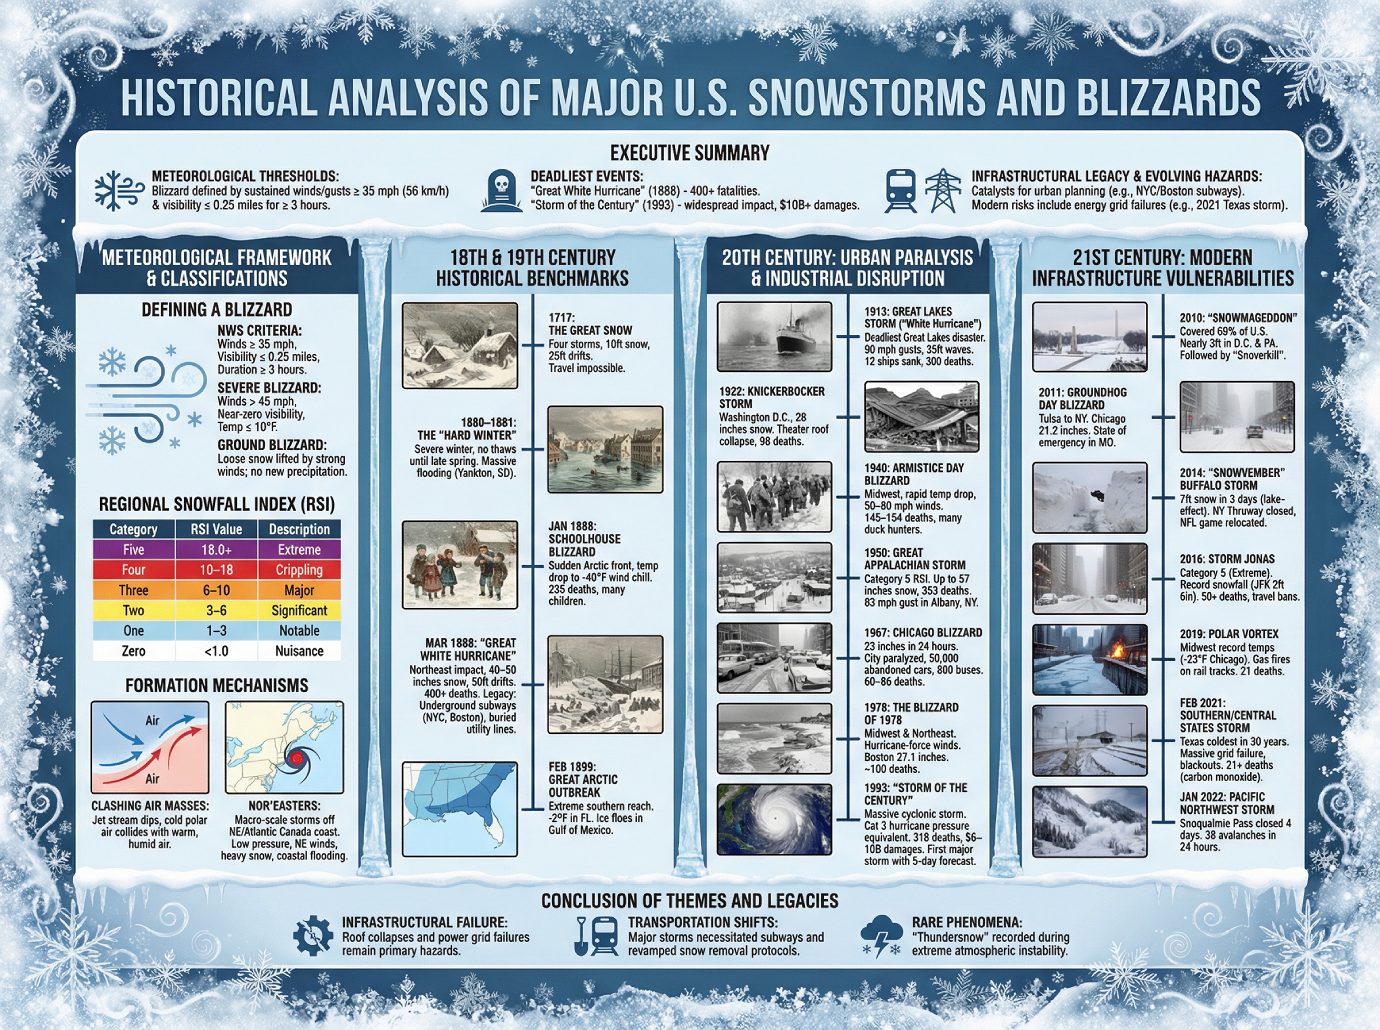
This briefing document synthesizes historical data and meteorological analysis regarding the most severe winter storms in United States history. Spanning from the early 18th century to the present, these events are categorized by their intensity, visibility, wind speed, and socio-economic impact.
Key findings include:
• Meteorological Thresholds: A blizzard is strictly defined by sustained winds or gusts of at least 35 mph (56 km/h) and visibility reduced to 0.25 miles or less for a minimum of three hours.
• Deadliest Events: The “Great White Hurricane” of 1888 remains the deadliest winter storm in U.S. history with over 400 fatalities. The “Storm of the Century” (1993) represents one of the most widespread, affecting 40% of the U.S. population and causing up to $10 billion in damages.
• Infrastructural Legacy: Major storms have historically served as catalysts for urban planning, including the development of underground subway systems in New York and Boston following the 1888 blizzard.
• Evolving Hazards: While modern forecasting has improved survival rates, recent events like the 2021 Texas snowstorm highlight ongoing vulnerabilities in energy grids and residential infrastructure not designed for extreme cold.
Meteorological Framework and Classifications
Defining a Blizzard
The distinction between a snowstorm and a blizzard is based on wind strength and visibility rather than the total volume of snowfall.
• U.S. National Weather Service (NWS) Criteria: Sustained winds or frequent gusts ≥ 35 mph (56 km/h) with blowing or drifting snow reducing visibility to ≤ 0.25 miles (400 m) for at least three hours.
• Severe Blizzard Threshold: Winds exceeding 45 mph (72 km/h), near-zero visibility, and temperatures at or below 10°F (-12°C).
• Ground Blizzard: Occurs when loose snow already on the ground is lifted by strong winds; no new precipitation is required.
Regional Snowfall Index (RSI)
The RSI is used to indicate how severely snowfall affects the population in a storm’s path.
| Category | RSI Value | Description |
|---|---|---|
| Five | 18.0+ | Extreme |
| Four | 10–18 | Crippling |
| Three | 6–10 | Major |
| Two | 3–6 | Significant |
| One | 1–3 | Notable |
| Zero | <1.0 | Nuisance |
Formation Mechanisms
• Clashing Air Masses: Blizzards often form when the jet stream dips south, allowing cold, dry polar air to collide with warm, humid air from the south (e.g., the Gulf of Mexico).
• Nor’easters: Macro-scale storms occurring off the New England and Atlantic Canada coasts. They are characterized by low-pressure centers just off the coast with leading winds from the northeast. They are known for high storm waves, coastal flooding, and heavy snow.
——————————————————————————–
18th and 19th Century Historical Benchmarks
The Great Snow (1717)
A series of four snowstorms between February 27 and March 7. Snow depths reached 10 feet, with drifts of 25 feet burying entire houses and making travel impossible until the snow melted.
The Great Plains and “Hard Winter” (1880–1881)
Characterized as one of the most severe winters in U.S. history, starting with a blizzard in October 1880. No thaws occurred until late spring, leading to massive flooding. The Missouri River overflowed, washing away most of Yankton, South Dakota. This winter was popularized in Laura Ingalls Wilder’s The Long Winter.
The Schoolhouse Blizzard (January 12–13, 1888)
A sudden Arctic front struck the Great Plains on an unseasonably warm day. Temperatures plummeted from above freezing to -40°F wind chill instantly. The death toll reached 235, many of whom were children attempting to walk home from school during the sudden whiteout.
The “Great White Hurricane” (March 11–14, 1888)
Impacted the Northeast with 40–50 inches of snow and drifts up to 50 feet.
• Casualties: Over 400 deaths, the highest recorded for a winter storm in the U.S.
• Impact: 200 ships foundered; telephone and rail service were wiped out for days.
• Legacy: Led to the burial of utility lines and the construction of the nation’s first underground subways in New York and Boston to prevent future gridlock.
The Great Arctic Outbreak (February 1899)
Notable for its extreme southern reach. Temperatures dropped to -2°F in Florida and -16°F in Louisiana. Washington D.C. saw 51 consecutive hours of snowfall. Ice floes from the Mississippi River entered the Gulf of Mexico, blocking river traffic.
——————————————————————————–
20th Century: Urban Paralysis and Industrial Disruption
The Great Lakes Storm (1913)
Known as the “White Hurricane,” it remains the deadliest natural disaster in the Great Lakes region. Gusts reached 90 mph with 35-foot waves. At least 12 ships sank and 300 people died, a higher toll than all other major Great Lakes disasters combined.
The Knickerbocker Storm (1922)
A record-breaking 28 inches of snow fell on Washington D.C. The storm is named for the Knickerbocker Theater, where the flat roof collapsed under the weight of wet snow during a screening, killing 98 people and injuring 133.
Armistice Day Blizzard (1940)
An unseasonably warm morning in the Midwest was followed by a “panhandle hook” storm with 50–80 mph winds and 20-foot drifts. 145–154 people died, many of whom were duck hunters stranded on Mississippi River islands who were unprepared for the single-digit temperatures.
The Great Appalachian Storm (1950)
A “Category 5” storm on the RSI, it brought as much as 57 inches of snow and 353 deaths. While rain and snow were significant, the wind was the primary factor; Albany, NY recorded its strongest ever gust at 83 mph.
Chicago Blizzard of 1967
An unexpected 23 inches of snow fell in 24 hours. The storm paralyzed the city, resulting in 50,000 abandoned cars and 800 abandoned Chicago Transit Authority buses. 60–86 people died.
The Blizzard of 1978
Impacted the Midwest and Northeast with hurricane-force winds and coastal flooding.
• New England Impact: Logan Airport recorded an 83 mph gust; Boston received 27.1 inches of snow.
• Ohio Impact: Considered the worst winter storm in Ohio’s history.
• Casualties: Approximately 100 people perished.
The 1993 “Storm of the Century”
A massive cyclonic storm that stretched from Canada to Central America.
• Meteorology: Central pressure of 960 mbar, comparable to a Category 3 hurricane.
• Impact: 318 deaths; 6–10 billion in damages. 10 million customers lost power.
• Advancement: The first major storm where NWS computer models allowed for a five-day warning, enabling governors to declare emergencies before snowfall began.
——————————————————————————–
21st Century: Modern Infrastructure Vulnerabilities
“Snowmageddon” (February 2010)
President Obama dubbed the February 5–6 blizzard “Snowmageddon.” It covered 69% of the U.S. in snow and dumped nearly 3 feet in Washington D.C. and Pennsylvania. A second storm, “Snoverkill,” followed five days later, resulting in D.C.’s snowiest winter on record.
Groundhog Day Blizzard (2011)
Impacted a vast area from Tulsa to New York. Chicago received 21.2 inches of snow, its third-largest blizzard. A state of emergency was declared in Missouri, and Kansas City received its third-ever blizzard warning.
“Snowvember” Buffalo Storm (2014)
Seven feet of snow fell in Buffalo, NY over three days (Nov 17–19) due to lake-effect banding. The storm closed 100 miles of the New York State Thruway and forced the relocation of an NFL game to Detroit.
Storm Jonas (January 2016)
A Category 5 (Extreme) storm that broke snowfall records in New York (2ft 6in at JFK Airport). It caused over 50 deaths and necessitated travel bans until roads were cleared.
2019 Polar Vortex
Arctic winds brought record-breaking temperatures to the Midwest, reaching -23°F in Chicago—colder than parts of Antarctica. Gas fires were used on rail tracks to keep trains moving. The storm resulted in 21 fatalities, primarily among those working outdoors or the homeless.
February 2021 Southern/Central States Storm
Brought the coldest temperatures to Texas in 30 years (-0.4°F).
• Grid Failure: Surge in power usage led to massive blackouts as the energy grid failed.
• Casualties: At least 21 deaths were reported; many were caused by carbon monoxide poisoning as residents used cars or generators for heat in homes not built for extreme cold.
January 2022 Pacific Northwest Storm
A whiteout on January 7 forced the Snoqualmie Pass (Interstate 90) to close for four days after 38 avalanches occurred in 24 hours.
——————————————————————————–
Conclusion of Themes and Legacies
The historical record indicates that while fatalities from lack of warning have decreased due to technological advancements (e.g., the transition from the 1940 Armistice Day failure to the 1993 success), the economic and infrastructural toll remains high.
• Infrastructural Failure: Roof collapses (1922, 1996, 2014) and power grid failures (1950, 2008, 2021) remain primary hazards.
• Transportation Shifts: Major storms in 1888 and 1969 necessitated the creation of subways and revamped municipal snow removal protocols.
• Rare Phenomena: Events such as “thundersnow” (rare lightning during snow) were recorded during the 2006 and 2010 storms, highlighting the extreme atmospheric instability present during historic blizzards. ————————-
The White Hurricane and the Birth of the Subway: How Extreme Winter Forced America to Rebuild
The White Hurricane and the Birth of the Subway: How Extreme Winter Forced America to Rebuild
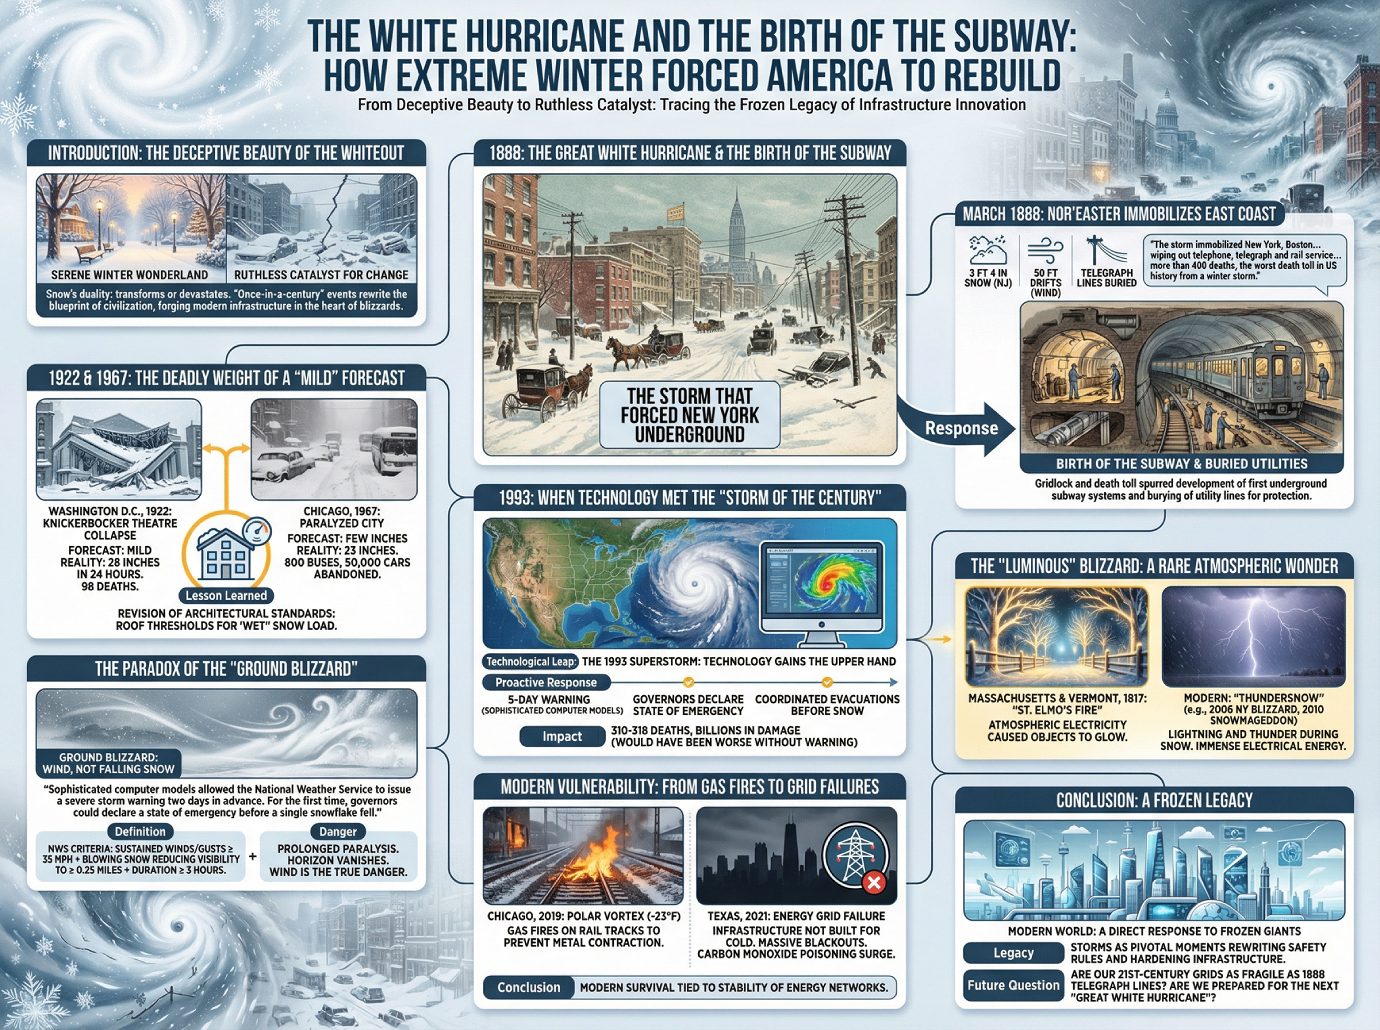
Introduction: The Deceptive Beauty of the Whiteout
Snow possesses a unique duality: it can transform a cityscape into a serene winter wonderland or leave behind a trail of total devastation. While a light flurry may suggest a cozy seasonal aesthetic, the annals of meteorological history show that extreme winter weather is often a ruthless catalyst for structural change. These “once-in-a-century” events have done more than break records; they have fundamentally rewritten the blueprint of American civilization. Understanding these historical pivots reveals that our modern infrastructure—from the transit systems beneath our feet to the forecast models on our phones—was often forged in the heart of a blizzard.
The Storm That Forced New York Underground
The 1888 Great White Hurricane remains the benchmark for winter devastation in the United States. In March of that year, a massive nor’easter immobilized the East Coast from the Chesapeake Bay to Maine. While the storm dumped staggering amounts of snow—including a precise 3 feet 4 inches in the hardest-hit areas of New Jersey—it was the wind that proved truly transformative. Vicious, hurricane-force gusts created drifts as high as 50 feet, reaching the second-story windows of many homes and burying the telegraph lines that were the lifeblood of 19th-century communication.
The impact was absolute. The immobilization of New York and Boston exposed the extreme fragility of above-ground infrastructure. In the following decade, the gridlock and death toll of 1888 directly spurred the development of the country’s first underground subway systems and the massive project of burying utility lines to protect them from the elements.
“The storm immobilized New York, Boston and other major cities, blocking roads and wiping out telephone, telegraph and rail service for several days… The disaster resulted in more than 400 deaths, the worst death toll in US history from a winter storm.”
The Deadly Weight of a “Mild” Forecast
The 1922 Knickerbocker Storm and the 1967 Chicago Blizzard serve as grim reminders of the dangers of a “surprise” forecast. In 1922, Washington D.C. was caught off guard after forecasts predicted mild weather; instead, the city was slammed with 28 inches of snow in 24 hours. This led to a catastrophic failure at the Knickerbocker Theatre, the capital’s largest and most modern movie house. During an intermission, the flat roof—unable to support the immense load of wet snow—collapsed onto the audience, killing 98 people.
Similarly, in 1967, Chicago was paralyzed by 23 inches of snow despite a prediction of only a few inches. The city stalled entirely, with 800 buses and 50,000 cars abandoned in the streets. For safety officials and engineers, the takeaway was clear: the depth of snow is often less critical than its weight. These tragedies forced a revision of architectural standards, specifically regarding roof thresholds for “wet” snow, proving that even the most “modern” buildings were vulnerable to atmospheric physics.
When Technology Met the “Storm of the Century”
The 1993 Superstorm was a turning point where technology finally gained the upper hand over nature’s unpredictability. Impacting 26 states, Canada, and Cuba, the storm featured a central pressure typically reserved for Category 3 hurricanes. While it caused between 310 and 318 deaths and billions in damage, the scale of the tragedy would have been far worse without a technological leap in meteorology.
For the first time, sophisticated computer models allowed the National Weather Service to provide a successful five-day warning. This allowed governors to declare states of emergency and coordinate evacuations before a single snowflake hit the ground. It transformed disaster response from a reactive scramble into a proactive survival strategy.
“Those staggering numbers might have been far worse, however, were it not for significant advances in U.S. weather forecasting… Sophisticated computer models allowed the National Weather Service to issue a severe storm warning two days in advance. For the first time, governors could declare a state of emergency before a single snowflake fell.”
The Paradox of the “Ground Blizzard”
A common misconception is that a blizzard requires falling precipitation. However, a Ground Blizzard occurs when strong winds lift and blow loose snow already on the surface. To meet the technical definition of a blizzard, the National Weather Service requires sustained winds or frequent gusts of at least 35 mph and blowing snow that reduces visibility to 0.25 miles or less—conditions that must persist for three hours or more.
This duration requirement is what makes a blizzard a “prolonged” event capable of paralyzing regions. In these whiteout conditions, the horizon vanishes, making it possible for people to become lost just yards from their doors. It is the wind, rather than the clouds, that creates the true danger.
Modern Vulnerability: From Gas Fires to Grid Failures
Despite our technological advancements, recent events like the 2019 Polar Vortex and the 2021 Southern Storm expose new layers of vulnerability. In 2019, temperatures in Chicago dropped to a record-breaking -23°F—at times colder than Antarctica—prompting the Illinois governor to declare a state of emergency. To keep the city’s transit moving, workers had to use gas fires on rail tracks to prevent the metal from contracting and cracking.
The 2021 storm in Texas revealed a different crisis: the failure of the energy grid. Because the regional infrastructure was not built to retain heat, the record cold caused massive blackouts. This forced residents into dangerous survival tactics, such as running cars or portable generators in enclosed garages to stay warm, leading to a tragic surge in carbon monoxide poisoning. It proved that in the modern era, our survival is tied directly to the stability of our energy networks.
The “Luminous” Blizzard: A Rare Atmospheric Wonder
Nature occasionally presents phenomena that border on the surreal. During the 1817 Luminous Blizzard in Massachusetts and Vermont, the storm was accompanied by “St. Elmo’s fire”—a form of atmospheric electricity. John Farrar, a professor at Harvard, recorded the event, describing how the electricity caused trees, fence posts, and even people to appear as if they were glowing in the dark.
Modern observers see a variation of this in “thundersnow,” recorded during the 2006 New York Blizzard and the 2010 “Snowmageddon.” These rare events, where lightning and thunder occur during a snowstorm rather than rain, remind us of the immense electrical energy contained within these massive winter systems.
Conclusion: A Frozen Legacy
From the subways beneath New York City to the sophisticated computer models that guide our daily commutes, the modern world is a direct response to the frozen giants of our past. These storms act as pivotal moments that rewrite safety rules and force us to harden our infrastructure against the wind and cold.
As our cities grow increasingly dependent on complex digital and energy networks, we must look back at the severed telegraph lines of 1888 and ask ourselves: are our 21st-century grids as fragile today as those wires were over a century ago? Are we truly prepared for the next “Great White Hurricane,” or are we still at the mercy of the wind? ————————————-
Frozen in Time: A Chronological Journey Through America’s Greatest Winter Storms (1880–Present)
Frozen in Time: A Chronological Journey Through America’s Greatest Winter Storms (1880–Present)
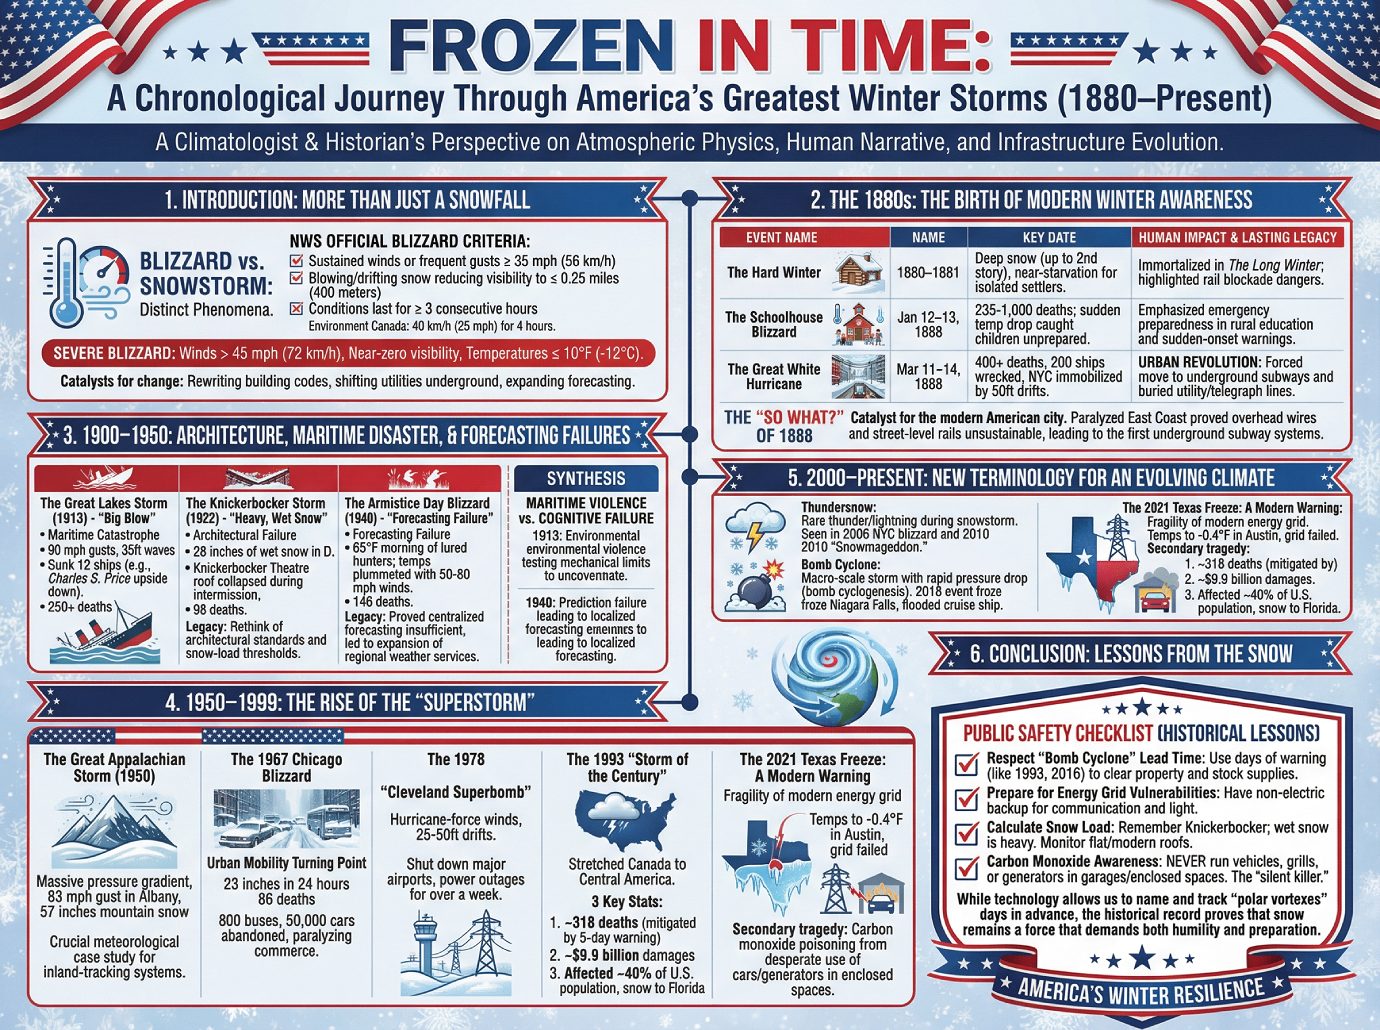
As a climatologist and historian, I have spent decades studying the intersection of atmospheric physics and human narrative. To the casual observer, a winter storm is merely an inconvenience or a “winter wonderland.” To the scientist and historian, these events are powerful environmental catalysts that expose the vulnerabilities of our infrastructure and force the evolution of our safety protocols.
1. Introduction: More Than Just a Snowfall
In common parlance, people often use the terms “snowstorm” and “blizzard” interchangeably, but in the field of meteorology, these are distinct phenomena. The National Weather Service (NWS) maintains a rigid set of standards to classify a storm as a true blizzard.
The Official Blizzard Criteria: To meet the NWS classification, a storm must sustain specific conditions for at least three consecutive hours: wind speeds or frequent gusts of at least 35 mph (56 km/h) and blowing or drifting snow that reduces visibility to 0.25 miles (400 meters) or less. Interestingly, our colleagues at Environment Canada utilize a slightly different threshold, requiring wind speeds of 40 km/h (25 mph) and four hours of duration. For the most extreme events, we use the term “Severe Blizzard,” reserved for storms with winds exceeding 45 mph (72 km/h), near-zero visibility, and temperatures of 10°F (-12°C) or lower.
These events are more than just weather data; they are pivotal moments that have rewritten American building codes, shifted utility lines underground, and expanded the reach of our forecasting technology. Our journey begins in the late 19th century, an era when a growing nation was first forced to reckon with the sheer power of the “white hurricane.”
——————————————————————————–
2. The 1880s: The Birth of Modern Winter Awareness
The late 19th century featured a series of winters so severe they remain the benchmark for meteorological violence. This era proved that as the nation modernized, its reliance on surface-level infrastructure made it incredibly vulnerable.
| Event Name | Key Date | Human Impact | Lasting Legacy |
|---|---|---|---|
| The Hard Winter | 1880–1881 | Deep snow accumulations up to second-story windows led to near-starvation for isolated settlers. | Immortalized in Laura Ingalls Wilder’s The Long Winter; highlighted the danger of rail blockades. |
| The Schoolhouse Blizzard | Jan 12–13, 1888 | 235 deaths (some estimates reaching 1,000); a sudden drop from above freezing to -40° wind chill caught children unprepared. | Dramatized the need for emergency preparedness in rural education and sudden-onset storm warnings. |
| The Great White Hurricane | Mar 11–14, 1888 | 400+ deaths; 200 ships wrecked; NYC immobilized by 50-foot snowdrifts. | Urban Revolution: Forced the move toward underground subways and buried utility/telegraph lines. |
The “So What?” of the 1888 Hurricane The March 1888 storm was the catalyst for the modern American city. By paralyzing the East Coast and cutting off all communication and transport, it proved that overhead wires and street-level rails were unsustainable. This disaster directly led to the breaking of ground for the nation’s first underground subway systems in New York and Boston.
——————————————————————————–
3. 1900–1950: Architecture, Maritime Disaster, and Forecasting Failures
As the 20th century dawned, the focus shifted from survival on the plains to the resilience of the nation’s burgeoning urban and maritime infrastructure.
• The Great Lakes Storm (1913): Known as the “Big Blow,” this was an unparalleled maritime catastrophe. With gusts of 90 mph and 35-foot waves, it sank 12 ships, including the Charles S. Price, which was famously found floating upside down. It killed over 250 people, more than all other major Great Lakes disasters combined.
• The Knickerbocker Storm (1922): This event is a somber reminder of the danger of “heavy, wet snow.”
◦ The Weight of Snow: 28 inches of wet snow fell on Washington D.C. in 24 hours.
◦ The Tragedy: The Knickerbocker Theatre, the capital’s most modern movie house, suffered a catastrophic failure when its flat roof collapsed during an intermission, killing 98 people.
◦ The Result: It forced a total rethink of architectural standards and snow-load thresholds for flat-roofed buildings.
• The Armistice Day Blizzard (1940): A catastrophic forecasting failure. A 65°F morning lured duck hunters into the Midwest marshes. By afternoon, temperatures plummeted to single digits as a “panhandle hook” storm brought 50-80 mph winds and 15-foot swells, killing 146 people.
Synthesis: Maritime Violence vs. Cognitive Failure The contrast between 1913 and 1940 highlights two distinct evolutionary pressures on safety. The 1913 “White Hurricane” was a lesson in environmental violence that tested the mechanical limits of ships and harbors. Conversely, the 1940 tragedy was a failure of prediction; it proved that centralized forecasting was insufficient for rapid-onset events, directly leading to the expansion of more localized, regional weather services.
——————————————————————————–
4. 1950–1999: The Rise of the “Superstorm”
The mid-to-late 20th century was defined by macro-scale systems that tested the resilience of the nation’s highway and energy systems.
The Great Appalachian Storm (1950)
This storm was characterized by a massive pressure gradient that produced an 83 mph wind gust in Albany—the strongest ever recorded there. Beyond its 57 inches of mountain snow, this event became a crucial meteorological case study later used by scientists to track and predict the complex movements of inland-tracking systems.
The 1967 Chicago Blizzard
This event served as a turning point for urban mobility. The city was paralyzed by 23 inches of snow in 24 hours. The human cost was high, with 86 deaths recorded. Commuters were forced into hotels as 800 buses and 50,000 cars were abandoned on the streets, essentially freezing the city’s commerce in place.
The 1978 “Cleveland Superbomb”
This “superbomb” featured hurricane-force winds and snowdrifts reaching 25-50 feet. It proved that even in the modern era, a storm could shut down major airports and leave residents without power for over a week.
The 1993 “Storm of the Century”
This system stretched from Canada to Central America and represents a triumph of modern forecasting. The 3 Most Significant Statistics:
1. Human Toll: Approximately 318 people lost their lives, though this number was mitigated by a successful five-day lead time warning from the NWS.
2. Economic Impact: The storm caused approximately $9.9 billion in inflation-adjusted damages.
3. Geographic Reach: The storm was experienced by nearly 40 percent of the U.S. population, dumping snow as far south as Florida.
——————————————————————————–
5. 2000–Present: New Terminology for an Evolving Climate
As we entered the 21st century, new meteorological phenomena entered the public lexicon, changing how we describe winter’s fury.
Thundersnow: A rare meteorological event where thunder and lightning occur during a snowstorm. While historically rare, it was notably observed during the record-breaking New York blizzard of 2006—the largest on record at the time—and the 2010 event dubbed “Snowmageddon” by President Obama.
Bomb Cyclone: A macro-scale storm that intensifies with explosive speed as its central pressure drops rapidly (bomb cyclogenesis). The 2018 “bomb cyclone” was so intense it caused Niagara Falls to appear “frozen” and led to the flooding of the Norwegian Breakaway cruise ship.
Polar Vortex: A large area of low pressure and cold air surrounding Earth’s poles. When the vortex weakens, it sends arctic winds southward, as seen in the 2019 Chicago cold wave where temperatures hit -23°F, forcing the use of gas fires on rail tracks to keep trains moving.
The 2021 Texas Freeze: A Modern Warning The February 2021 storm highlighted the fragility of the modern energy grid. As temperatures dropped to -0.4°F in Austin, the grid failed under record demand. This led to a secondary, silent tragedy: carbon monoxide poisoning. Victims, desperate for warmth in homes not built for extreme cold, ran cars or generators in enclosed garages. Because carbon monoxide is odorless and colorless, it became a silent killer during the grid collapse, proving that infrastructure failure remains our greatest modern winter threat.
——————————————————————————–
6. Conclusion: Lessons from the Snow
The historical record proves that snow remains a force that demands respect. While we have moved from the struggle for basic survival on the plains to protecting complex electrical grids, the lessons of the past provide our best blueprint for the future.
Public Safety Checklist (Historical Lessons):
• Respect the “Bomb Cyclone” Lead Time: Modern technology now provides days of warning (as seen in 1993 and 2016); use this time to clear property and stock supplies before the “bomb” drops.
• Prepare for Energy Grid Vulnerabilities: Power outages are the most common secondary threat; always have a non-electric backup for communication and light.
• Calculate Snow Load: Remember the Knickerbocker Theatre; wet snow is significantly heavier than dry powder. If your roof is flat or modern, monitor accumulation levels.
• Carbon Monoxide Awareness: Never run a vehicle, grill, or generator in a garage or enclosed space. In a grid failure, the cold is dangerous, but the “silent killer” of carbon monoxide is often more so.
While technology allows us to name and track “polar vortexes” days in advance, the historical record proves that snow remains a force that demands both humility and preparation. —————————–
The Winter Storm Severity Handbook: Understanding the Regional Snowfall Index (RSI)
The Winter Storm Severity Handbook: Understanding the Regional Snowfall Index (RSI)
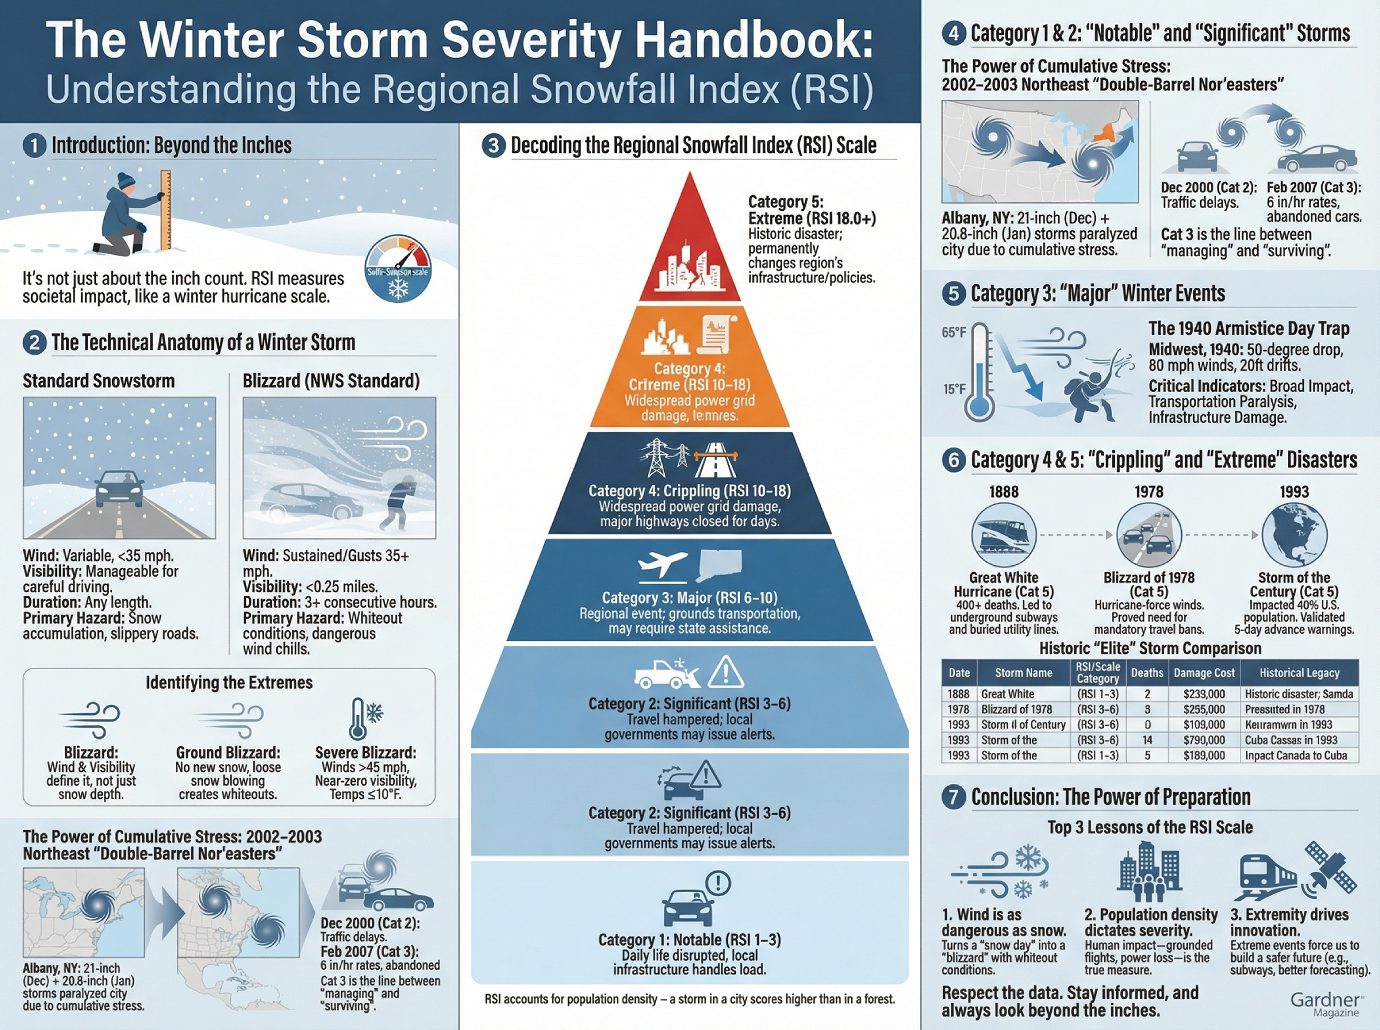
1. Introduction: Beyond the Inches
When a winter storm begins to brew, the first question most of us ask is, “How many inches are we going to get?” It is a natural reaction, but as a meteorologist, I have to let you in on a secret: the “inch count” is often the least interesting part of the story. A foot of snow in a remote corner of the Adirondacks is a beautiful Tuesday; that same foot of snow falling during rush hour in a densely packed city is a catastrophic emergency.
To truly understand the danger of a storm, we must look beyond the depth of the snow and examine its relationship with the people in its path. This is why scientists developed the Regional Snowfall Index (RSI). Think of the RSI as the winter equivalent of the Saffir-Simpson scale for hurricanes. It doesn’t just measure a physical event; it measures a societal impact. In this handbook, we will explore how we categorize these frozen giants, moving from the technical anatomy of the wind to the historic disasters that forced us to reinvent our cities.
——————————————————————————–
2. The Technical Anatomy of a Winter Storm
Before we can rank a storm’s impact, we have to know exactly what we are dealing with. In the world of science communication, we often see the word “blizzard” used as a synonym for any heavy snowstorm. However, the National Weather Service (NWS) maintains very strict criteria for that title. Interestingly, a blizzard is defined not by how much snow falls from the sky, but by the violence of the wind and the clarity of the air.
Comparison: Standard Snowstorm vs. Blizzard
The following table illustrates why a “Standard Snowstorm” is a local inconvenience, while a “Blizzard” is a life-threatening event.
| Criteria | Standard Snowstorm | Blizzard (NWS Standard) |
|---|---|---|
| Wind Speed | Variable, typically under 35 mph | Sustained or frequent gusts of 35 mph or greater |
| Visibility | Generally manageable for careful driving | 0.25 miles or less due to blowing or drifting snow |
| Duration | Any length of time | Must persist for 3 consecutive hours or more |
| Primary Hazard | Snow accumulation and slippery roads | Whiteout conditions and dangerous wind chills |
Identifying the Extremes
• Blizzard: The defining factor is wind and visibility. You can have a blizzard with only an inch of new snow if the winds are fierce enough to turn that snow into a blinding wall of white.
• Ground Blizzard: This occurs when no new snow is falling. Instead, strong winds pick up loose snow already on the ground, creating whiteouts.
• Severe Blizzard: These are truly terrifying events. To meet this threshold, winds must exceed 45 mph, visibility must be near zero, and temperatures must be 10°F or lower.
Once a storm meets these technical thresholds, meteorologists use the RSI scale to communicate how much disruption you should expect.
——————————————————————————–
3. Decoding the Regional Snowfall Index (RSI) Scale
The Regional Snowfall Index (RSI) is the primary tool used by the National Centers for Environmental Information (NCEI) to categorize the impact of winter storms. It replaced older scales because it accounts for population density. If a storm hits a major metropolitan area, its RSI score climbs significantly higher than a storm of the same size hitting a forest.
1. Category 1: Notable (RSI 1–3)
◦ Daily life is disrupted, but local infrastructure handles the load.
2. Category 2: Significant (RSI 3–6)
◦ Travel is hampered; local governments may issue weather alerts.
3. Category 3: Major (RSI 6–10)
◦ A regional event that grounds transportation and may require state assistance.
4. Category 4: Crippling (RSI 10–18)
◦ Widespread damage to the power grid and total closure of major highways for days.
5. Category 5: Extreme (RSI 18.0+)
◦ A historic disaster that permanently changes the region’s infrastructure or policies.
These categories act as a shorthand for emergency services, helping them decide when to call in the National Guard or declare a state of emergency.
——————————————————————————–
4. Category 1 & 2: ‘Notable’ and ‘Significant’ Storms
Most winter events fall into these first two tiers. While they are often dismissed as “nuisance” storms, they can be the most dangerous for motorists. Because the public perceives these as “just snow,” they often under-prepare, leading to higher rates of preventable traffic accidents.
The Power of Cumulative Stress
We can see the importance of these categories by looking at the 2002–2003 winter season in the Northeast. This year featured what we call “Double-Barrel Nor’easters.” In Albany, NY, for instance, a 21-inch storm hit on Christmas, followed by a 20.8-inch storm just days later on January 3-4. Individually, these are manageable, but the cumulative stress on salt supplies and snow removal budgets can paralyze a city.
To see the jump in severity, compare the December 2000 Storm (Category 2) with the February 2007 Valentine’s Day Blizzard (Category 3). While the 2000 storm caused traffic delays and school closures, the 2007 event saw snowfall rates of 6 inches per hour and forced motorists to abandon their cars in the middle of highways. That move from Category 2 to 3 is the line where “managing the snow” becomes “surviving the storm.”
——————————————————————————–
5. Category 3: ‘Major’ Winter Events
When a storm hits Category 3, it is no longer a local issue—it is a regional crisis. These events are often characterized by broad geographic impact and the total grounding of transportation.
The 1940 Armistice Day Trap
The 1940 Armistice Day Blizzard is the ultimate cautionary tale of the Category 3 “Major” event. The morning began at a balmy 65°F in the Midwest, drawing hundreds of duck hunters out to the marshes in light clothing. Suddenly, the pressure crashed, and an Arctic front collided with Gulf moisture. Temperatures plummeted 50 degrees in a few hours. The result was 20-foot snowdrifts and 80 mph winds. Stranded on small islands, many hunters either drowned or froze to death.
Critical Indicators of Category 3
• Broad Impact: The storm spans multiple states, making it impossible for neighbors to share resources.
• Transportation Paralysis: Airports close for days, and even heavy plows struggle to keep interstates open.
• Infrastructure Damage: The weight of heavy snow often leads to roof collapses and widespread power outages.
——————————————————————————–
6. Category 4 & 5: ‘Crippling’ and ‘Extreme’ Disasters
The highest tiers of the RSI are reserved for storms that redefine a region’s history. These events don’t just clear the shelves of bread and milk; they force us to rethink how we build our world.
Case Studies in Extremity
The 1888 Great White Hurricane remains the benchmark for “Extreme” disasters. With 50-foot drifts and over 400 deaths, it exposed a fatal flaw in our cities: above-ground utility lines. The weight of the snow and ice snapped telegraph and power lines across the Northeast, cutting off all communication. This “aggressive shove from Mother Nature” forced the creation of the country’s first underground subway systems and the burying of utility lines.
The Blizzard of 1978 was another transformative event. It struck the Northeast with hurricane-force winds (gusts reached 92 mph on Cape Cod) and whiteout conditions. Because initial forecasts didn’t capture the storm’s speed, commuters were caught on the roads. Thousands of cars were abandoned on Route 128 in Massachusetts, buried to their roofs. This tragedy highlighted the desperate need for better regional forecasting and emergency travel bans.
Finally, the 1993 Storm of the Century showed the massive scope of an RSI Category 5 storm. It stretched from Canada to Cuba, impacting 40% of the U.S. population and causing up to $10 billion in damages.
Historic “Elite” Storm Comparison
| Date | Storm Name | RSI/Scale Category | Deaths | Damage Cost | Historical Legacy |
|---|---|---|---|---|---|
| March 1888 | Great White Hurricane | Category 5 | 400+ | Millions | Led to underground subways and utility lines. |
| Nov. 1940 | Armistice Day Blizzard | Category 3* | 146+ | Significant | Forced the expansion of localized forecasting. |
| Feb. 1978 | Blizzard of 1978 | Category 5 | 100 | $500M+ | Proved the need for mandatory travel bans. |
| March 1993 | Storm of the Century | Category 5 | 318 | $6B – $10B | Validated the success of 5-day advance warnings. |
| Jan. 1996 | North American Blizzard | Category 5 | 154 | $3B+ | Proved post-storm flooding is as deadly as snow. |
*Note: While 1940 was “Major,” its RSI ranking is often applied retrospectively to study its unique impact on forecasting protocols.
——————————————————————————–
7. Conclusion: The Power of Preparation
As we have seen, the Regional Snowfall Index is more than just a table of numbers—it is a record of our ongoing struggle and adaptation to the environment. For the readers of Gardner Magazine, the RSI offers a way to internalize the data provided by your local meteorologist.
The Top 3 Lessons of the RSI Scale
1. Wind is as dangerous as snow: High winds turn a “snow day” into a “blizzard,” creating whiteout conditions where people can get lost just steps from their front doors.
2. Population density dictates severity: The RSI reminds us that the human impact—the grounding of flights, the loss of power, and the risk to life—is the true measure of a storm.
3. Extremity drives innovation: From the subways of 1888 to the advanced satellite forecasting that saved lives in 1993, we have always used these “Extreme” events to build a safer future.
Respecting the data is your first line of defense. When you hear that an RSI Category 4 or 5 is approaching, remember the history behind those numbers. Stay safe, stay informed, and always look beyond the inches. ——————————
Historical Analysis of American Winter Disaster Management: Economic Impacts and Response Efficacy
Historical Analysis of American Winter Disaster Management: Economic Impacts and Response Efficacy
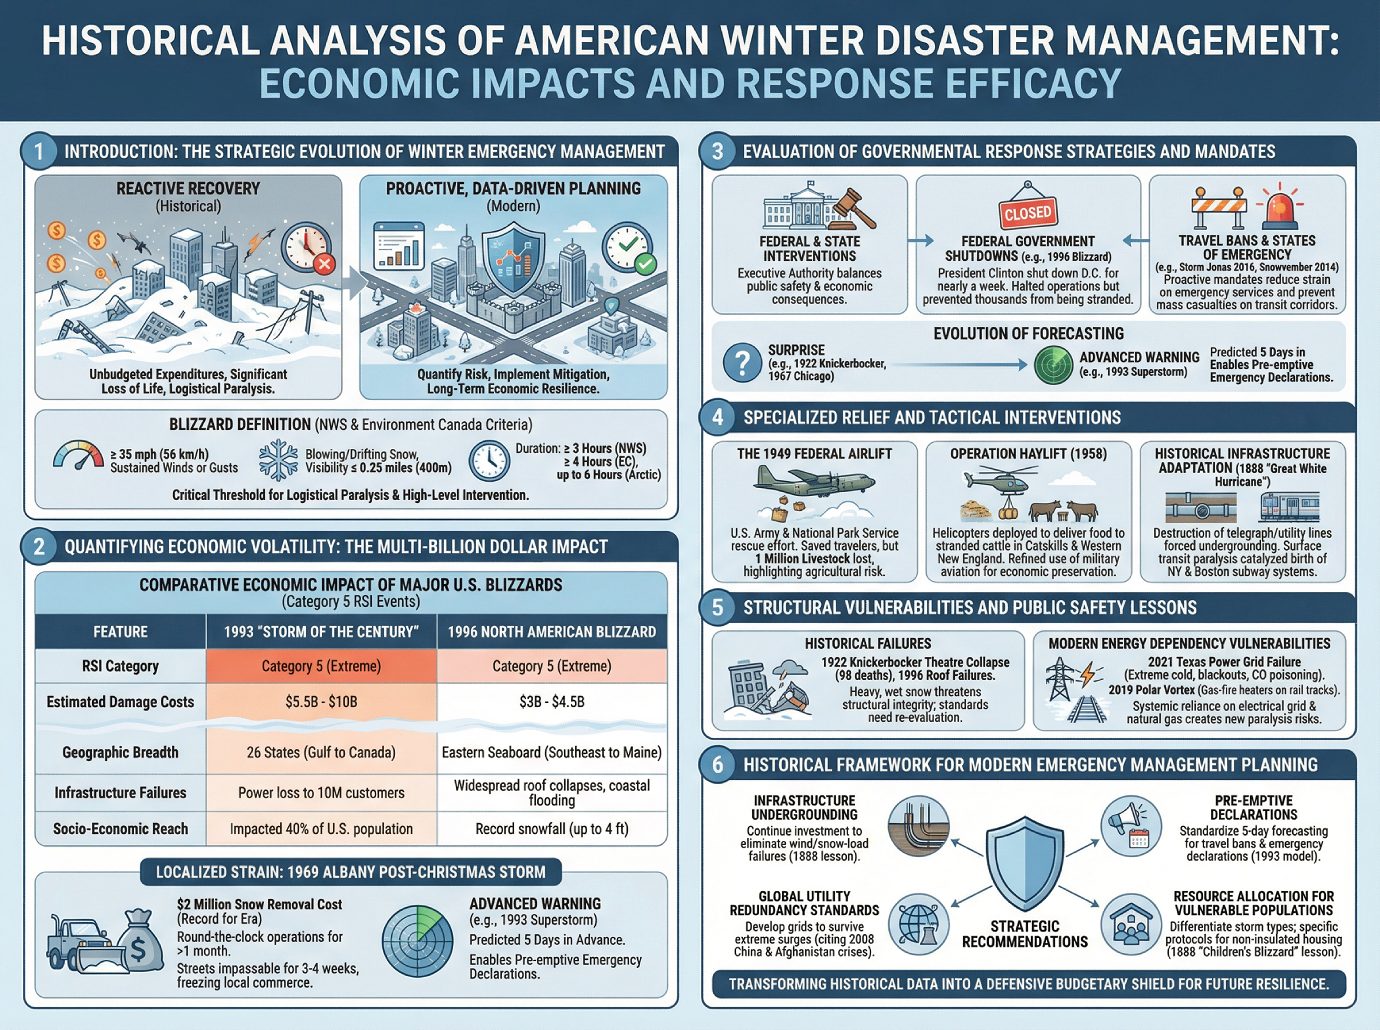
1. Introduction: The Strategic Evolution of Winter Emergency Management
Record-breaking winter storms represent far more than extreme meteorological phenomena; they are profound stressors that test the resilience of national infrastructure and the stability of fiscal budgets. Historically, municipalities have approached these events with reactive recovery models, often resulting in unbudgeted expenditures and significant loss of life. However, the strategic evolution of emergency management now demands a transition toward proactive, data-driven planning. By utilizing historical precedents, strategic analysts can quantify risk and implement mitigation strategies before a crisis occurs, transforming disaster response from an emergency expense into a calculated element of long-term economic resilience.
The distinction between a standard snowstorm and a catastrophic blizzard is defined by specific atmospheric intensity benchmarks rather than simple accumulation. According to the National Weather Service (NWS), a blizzard requires sustained winds or frequent gusts of at least 35 mph (56 km/h) and blowing or drifting snow that reduces visibility to 0.25 miles (400 meters) or less for a minimum of three hours. Environment Canada maintains similar criteria but extends the duration threshold to four hours, and up to six hours north of the arctic tree line. These thresholds are critical from a strategic standpoint; they represent the precise point at which visibility and wind speeds induce logistical paralysis, rendering standard transit and emergency services inoperable and necessitating high-level governmental intervention to prevent systemic collapse.
2. Quantifying Economic Volatility: The Multi-Billion Dollar Impact
Financial damage assessments serve as the foundation for modern budgetary considerations and insurance risk modeling. In the wake of major winter events, the fiscal exposure extends beyond immediate property damage to encompass lost productivity, utility restoration, and the massive costs associated with municipal snow removal. Quantifying these losses is essential for justifying the upfront costs of infrastructure hardening.
The economic scale of these disasters is best illustrated by comparing two of the most significant Category 5 events of the late 20th century: the 1993 “Storm of the Century” and the North American Blizzard of 1996.
Comparative Economic Impact of Major U.S. Blizzards
| Feature | 1993 “Storm of the Century” | 1996 North American Blizzard |
|---|---|---|
| Regional Snowfall Index (RSI) | Category 5 (Extreme) | Category 5 (Extreme) |
| Estimated Damage Costs | $5.5 Billion to $10 Billion | $3 Billion to $4.5 Billion |
| Geographic Breadth | 26 States (Gulf of Mexico to Canada) | Eastern Seaboard (Southeast to Maine) |
| Infrastructure Failures | Power loss to 10 million customers | Widespread roof collapses; coastal flooding |
| Socio-Economic Reach | Impacted 40% of the U.S. population | Record snowfall (up to 4 feet in places) |
Beyond regional catastrophes, localized economic strain can disrupt municipal public works for years. The 1969 Albany post-Christmas storm serves as a vital case study, where a $2 million price tag for snow removal—a record for the era—was driven by heavy, wet snow that forced the city to conduct round-the-clock removal operations for over a month. Critically, many streets remained entirely impassable for 3–4 weeks, freezing local commerce and depleting annual public works budgets. These massive financial losses are frequently the result of specific failures in transportation networks and utility distribution that could have been mitigated through superior forecasting and pre-positioning.
3. Evaluation of Governmental Response Strategies and Mandates
Executive authority plays a pivotal role in mitigating the loss of life during extreme weather events. State and federal leaders must balance the immediate need for public safety against the significant economic consequences of shutting down regional commerce.
Federal and State Interventions
• Federal Government Shutdowns: During the 1996 blizzard, President Bill Clinton utilized executive authority to shut down the Federal Government in Washington, D.C., for nearly a week. While this halted regional operations, it served as a critical safety mandate that prevented thousands of federal employees from becoming stranded in life-threatening conditions.
• Travel Bans and States of Emergency: Proactive mandates are now a standard tool for mitigating logistical paralysis. During Storm Jonas (2016), travel bans were implemented across major hubs, effectively reducing the strain on emergency services. Similarly, the strategic closure of the New York State Thruway during the 1976 flash freeze and the 2014 “Snowvember” storm prevented mass casualties on high-speed transit corridors.
• The Evolution of Forecasting: The shift from the “surprise” nature of the 1922 Knickerbocker Storm and the 1967 Chicago Blizzard to the advanced warning systems of today has changed the “So What?” for state governors. The 1993 Superstorm, for example, was predicted five days in advance, allowing for the pre-emptive declaration of emergencies. Analysts use record low barometric pressures—such as the 28.68 inHg recorded in Albany in 1993—to justify the “Extreme” (Category 5) classification to stakeholders, enabling the allocation of resources before the first snowflake falls.
4. Specialized Relief and Tactical Interventions: From ‘Operation Haylift’ to Modern Logistics
When a storm reaches Category 5 on the RSI, standard emergency services often become immobilized, necessitating specialized military and tactical relief to prevent a complete collapse of the regional economy and food supply.
1. The 1949 Federal Airlift: Following a three-day January blizzard that isolated the Western U.S., the U.S. Army and National Park Service collaborated on a massive rescue effort. Beyond saving stranded travelers, the operation was a critical economic intervention, yet it could not prevent the devastating loss of one million livestock, highlighting the magnitude of risk to the agricultural sector.
2. Operation Haylift (1958): During the 1958 blizzard, helicopters were deployed to the Catskills and Western New England to deliver food to stranded cattle. This represented a refined use of military aviation for economic preservation when road infrastructure was rendered useless by 30-inch accumulations.
3. Historical Infrastructure Adaptation: The “Great White Hurricane” of March 1888 serves as the primary historical baseline for structural resilience. The storm’s destruction of thousands of surface-level telegraph and utility lines forced a strategic shift toward the undergrounding of utility infrastructure. Furthermore, the total paralysis of surface transit catalyzed the birth of the New York and Boston subway systems. This was a fundamental resilience shift: moving from vulnerable surface-level transit to protected subterranean systems to ensure long-term economic continuity.
5. Structural Vulnerabilities and Public Safety Lessons
Historical failures in building codes and utility resilience provide the baseline for modern mitigation. The impact of heavy, wet snow remains a primary threat to structural integrity, particularly where architectural standards are insufficient.
The 1922 Knickerbocker Theatre collapse, which killed 98 movie-goers, and the widespread roof failures during the 1996 blizzard, prove that structural thresholds must be constantly re-evaluated. However, modern energy dependency has created new vulnerabilities that historical storms did not face. The 2021 Texas power grid failure demonstrated that modern infrastructure is often unprepared for extreme cold, leading to blackouts and preventable deaths from carbon monoxide poisoning because residential structures were not “built to retain heat.”
Furthermore, the 2019 Polar Vortex required tactical interventions such as gas-fire heaters on rail tracks to keep switches from freezing. These events prove that while we have solved the telegraph failures of 1888, our systemic reliance on the electrical grid and natural gas heating creates a different, yet equally severe, vulnerability to logistical paralysis.
6. Historical Framework for Modern Emergency Management Planning
Strategic necessity dictates the use of the Regional Snowfall Index (RSI) and historical mortality data—from the 400+ deaths in 1888 to the 4,000 fatalities in the 1972 Iran Blizzard—to justify modern emergency budgets.
Based on the historical record, planners should prioritize these four “Strategic Recommendations”:
• Infrastructure Undergrounding: Continued investment in moving utility and communication lines underground (the 1888 lesson) to eliminate wind and snow-load failures that trigger systemic collapse.
• Pre-emptive Declarations: Standardizing the use of five-day forecasting to issue travel bans and emergency declarations, modeled on the successful warning period of the 1993 Superstorm.
• Global Utility Redundancy Standards: Developing energy grids capable of surviving extreme surges, citing the 2008 China and Afghanistan crises (where 129 people died in China and 100,000 livestock perished in Afghanistan) as proof that utility failure is a global threat to fiscal stability.
• Resource Allocation for Vulnerable Populations: Differentiating between storm types is vital. Planners must use the lesson of the January 1888 “Children’s Blizzard”—where a sudden temperature drop from freezing to a -40 wind chill killed 235 people—to justify specific protocols for those in non-insulated housing, separate from the infrastructure lessons of the March 1888 storm.
Ultimately, the transformation of historical data into a defensive budgetary shield ensures that municipalities are not merely reacting to the next “Great White Hurricane,” but are actively prepared for the financial and logistical demands of future winter catastrophes. ——————————-
Resilience by Design: Historical Winter Weather Failures as Catalysts for Urban Adaptation
Resilience by Design: Historical Winter Weather Failures as Catalysts for Urban Adaptation
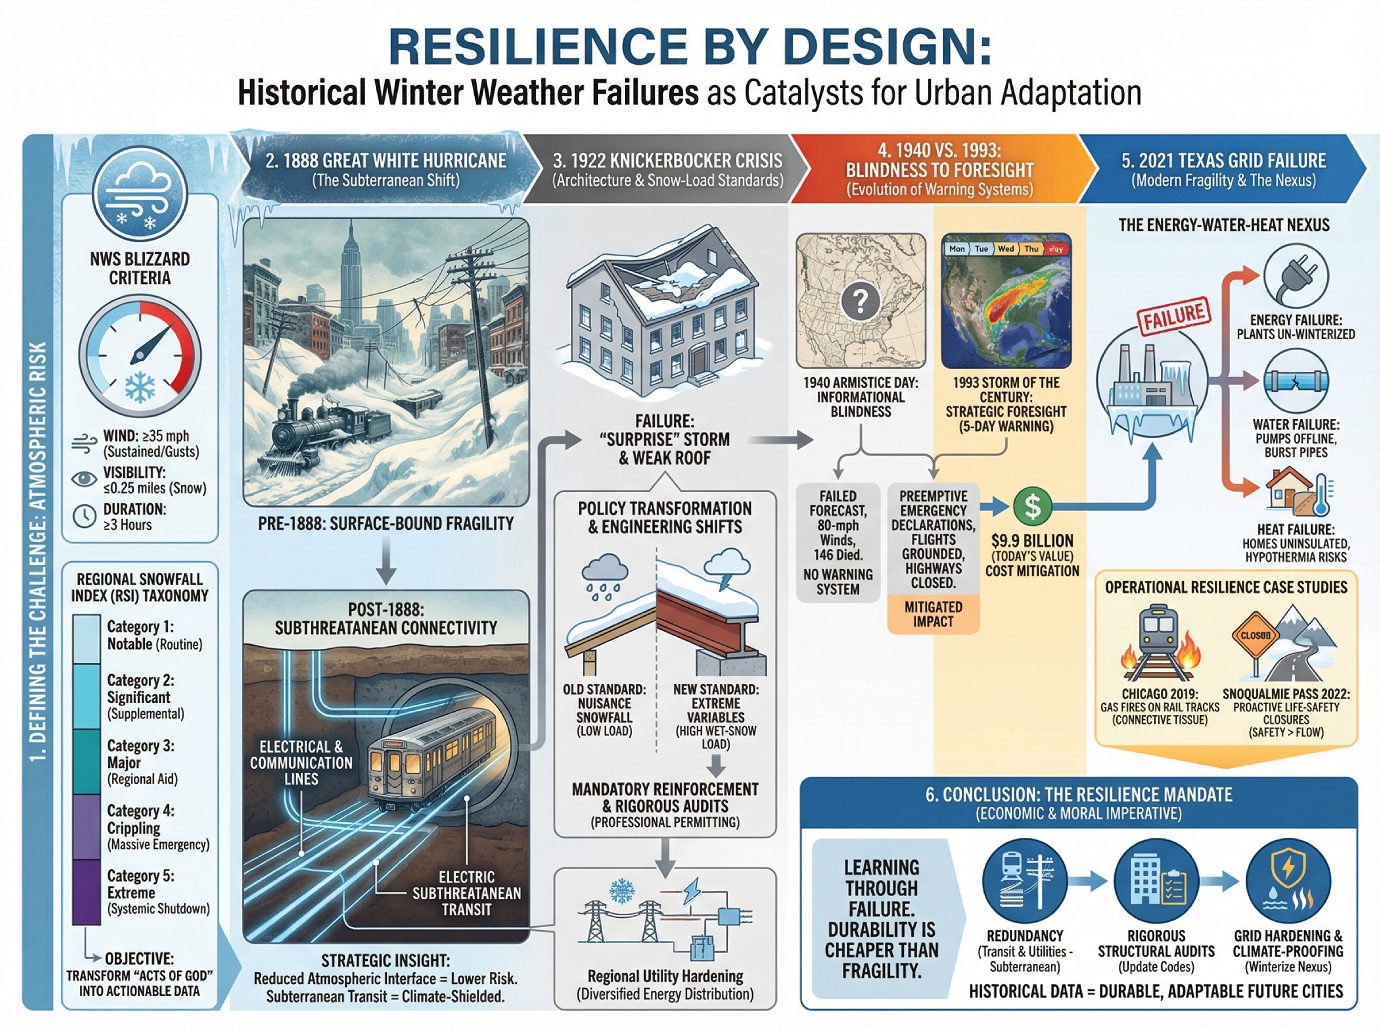
1. Foundations of Atmospheric Risk: Defining the Blizzard Challenge
In the discipline of urban resilience, a “blizzard” is defined not merely by the volume of frozen precipitation, but by a specific trifecta of atmospheric conditions that threaten to destabilize the structural and social equilibrium of a city. The National Weather Service maintains rigorous criteria for this classification: sustained winds or frequent gusts of ≥35 mph, visibility restricted to ≤0.25 miles by blowing or drifting snow, and a duration of at least three hours. For the infrastructure historian, these metrics represent the threshold where traditional surface operations transition from “difficult” to “mathematically impossible.”
To quantify these threats, municipal leaders utilize the Regional Snowfall Index (RSI). This taxonomy moves beyond simple weather reporting to serve as a critical instrument for risk assessment and resource allocation:
| RSI Category | Description | Strategic Municipal Implication |
|---|---|---|
| Category 1 | Notable | Routine maintenance; standard salt/plow deployment. |
| Category 2 | Significant | Triggers supplemental labor and equipment leasing. |
| Category 3 | Major | Justifies regional mutual aid and emergency declarations. |
| Category 4 | Crippling | Authorizes massive emergency overtime budgets and military support. |
| Category 5 | Extreme | Demands total systemic shutdown and long-term federal recovery funding. |
The objective of this analysis is to transform historical “acts of God” into actionable data points. By evaluating past failures, we justify the proactive investments required to harden urban systems against future atmospheric volatility.
2. The 1888 “Great White Hurricane” and the Subterranean Shift
The “Great White Hurricane” of March 1888 remains the seminal turning point in American infrastructure history. Over 400 people perished as 50-inch snowdrifts and hurricane-force winds decimated the “visual city”—a 19th-century urban model characterized by a dense, fragile web of overhead telegraph wires and surface-level steam transport.
The total immobilization of New York and Boston exposed a critical strategic vulnerability: above-ground connectivity is inherently incompatible with extreme winter weather. The resulting gridlock forced a radical adaptation mandate, shifting the city’s life-blood—its transit and communications—beneath the frost line.
Infrastructure Failure and Adaptation: 1888 Case Study
| Pre-1888 Infrastructure Vulnerabilities | Post-1888 Adaptations | Strategic Resilience Insight |
|---|---|---|
| Overhead Telegraph/Power Wires: Wind and ice load caused widespread collapse, severing the command-and-control capacity of the city. | Burying of Utilities: Development of subterranean conduits for electrical and communication lines to ensure climate-shielded connectivity. | Removing critical systems from the atmospheric interface reduces the surface area of risk. |
| Surface-Level Steam Rail: Locomotives were easily interred by drifts; open-air tracks were subject to freezing and mechanical failure. | Electric Subterranean Transit: Ground broken on New York and Boston subways, utilizing electric power to avoid the ventilation and freezing issues of steam. | Moving to subterranean environments creates a controlled climate for transit, independent of surface weather. |
| Surface-Bound Supply Chains: Street gridlock prevented coal deliveries, leading to mass heat loss and secondary fatalities. | Regional Utility Hardening: Shift toward centralized and diversified energy distribution models to prevent localized supply chain failures. | Redundancy in fuel and energy distribution is a prerequisite for survival in a multi-day blizzard event. |
While this shift underground solved the crisis of movement, the urban environment soon faced a new failure mode: the physical weight of the atmosphere upon the architecture itself.
3. The Knickerbocker Crisis: Architecture and Snow-Load Standards
The 1922 Knickerbocker Storm in Washington, D.C., was a catastrophic failure of engineering assumptions. While the 28-inch snowfall was high, the tragedy was driven by the “surprise” nature of the event—forecasters had predicted mild weather just 24 hours prior—and a fatal misunderstanding of static load-bearing variables.
The collapse of the Knickerbocker Theatre roof, which killed 98 people, revealed that the city’s public venues were not designed for the density of wet snow accumulation. This event forced a strategic shift from voluntary guidelines to mandatory, professionalized building codes and municipal liability oversight.
Policy Transformation and Engineering Shifts
The failure of the Knickerbocker Theatre catalyzed the following safety and engineering mandates:
• Revision of Snow-Load Requirements: Engineers shifted from “nuisance” snowfall assumptions to “extreme precipitation variables,” requiring roofs to support much higher weight-per-square-foot ratios based on wet snow density.
• Professionalization of Permitting: The disaster ended the era of architectural guesswork, requiring rigorous structural load audits and peer-reviewed blueprints for public venues.
• Mandatory Structural Reinforcement: Municipalities began requiring steel and concrete reinforcements for large-span flat roofs, acknowledging that “static” loads are actually dynamic and volatile in high-precipitation zones.
4. From Blindness to Foresight: The Evolution of Forecasting and Public Safety
Information is a foundational layer of urban infrastructure. The history of American winter weather adaptation is marked by the transition from the “informational blindness” of the early 20th century to the “strategic foresight” of the 1990s.
The 1940 Armistice Day Blizzard serves as the ultimate benchmark for the cost of informational failure. A “balmy 50-degree” morning lured hundreds of duck hunters onto the Mississippi River, only to be caught by a 50-degree temperature plunge and 80-mph winds that dropped temperatures to single digits overnight. 146 people died because of a lack of localized, 24-hour weather monitoring. This tragedy was the catalyst for the expansion of the National Weather Service and the professionalization of public warning systems.
In contrast, the 1993 “Storm of the Century” proved the success of information as infrastructure. Despite its massive cyclonic intensity and a death toll of 310–318 people, the impact was significantly mitigated by a five-day advance warning. This allowed:
• Preemptive Emergency Declarations: Governors in 26 states declared states of emergency before snowfall began, a paradigm shift from “Response” to “Readiness.”
• Economic Mitigation: While the storm cost an estimated $9.9 billion in today’s value, the ability to ground flights and close highways in advance prevented the catastrophic 100-car pile-ups and gridlock seen in un-warned historical events.
5. Modern Fragility: Energy Grids and the New Frontier of Resilience
As we have solved the problems of transit and information, we have entered a new era of risk: the “Energy-Water-Heat Nexus.” Modern cities are more interconnected than ever, but this interconnectedness creates a single point of failure: the energy grid. Even with “perfect information” from advanced forecasting, the physical “connective tissue” of the city can still collapse if not sufficiently hardened.
The 2021 Texas grid failure is the premier example of this nexus in crisis. When temperatures in Austin fell to -0.4°F, the uninsulated energy infrastructure failed under unprecedented demand. This triggered a cascading systemic collapse:
1. Energy Failure: Un-winterized power plants tripped offline.
2. Water Failure: Lack of power meant water treatment plants and pumps could not maintain pressure, leading to burst pipes and loss of potable water.
3. Heat Failure: Residents in homes built for heat dissipation rather than thermal retention were left in sub-freezing conditions, leading to fatalities from hypothermia and carbon monoxide poisoning.
Case Studies in Operational Resilience
Urban strategists have begun implementing creative, decentralized adaptations to prevent such systemic collapses:
• Operational Adaptation (Chicago 2019): During the -23°F Polar Vortex, Chicago utilized gas fires on rail tracks to prevent switch freezing, ensuring the city’s transit remained a functional “connective tissue.”
• Proactive Life-Safety Closures (Snoqualmie Pass 2022): Facing 38 avalanches in 24 hours, officials enforced a four-day closure of Interstate 90, prioritizing human safety over the immediate economic flow of the pass.
6. Conclusion: The Economic and Moral Imperative for Durability
The narrative of urban resilience is a continuous cycle of learning through failure. Every subterranean subway, reinforced theater roof, and winterized turbine is a memorial to those lost in the “Great White Hurricane” or the Knickerbocker disaster.
The strategic investment case is clear: the “nuisance” costs of proactive winterization are negligible compared to the “crippling” costs of failure. The $9.9 billion today’s-value cost of the 1993 storm demonstrates that systemic fragility is far more expensive than durability.
The Resilience Mandate for Municipal Leaders
To safeguard future urban development, leaders must focus on three critical takeaways:
1. Redundancy in Transit and Utilities: Prioritize subterranean and climate-shielded infrastructure for all critical communication and transit lines (Lessons from 1888).
2. Rigorous Structural Load Audits: Maintain and update architectural codes to account for the increasing weight of extreme, wet precipitation events on aging public structures (Lessons from 1922).
3. Grid Hardening and Climate-Proofing: Invest in the aggressive winterization of power generation and distribution to prevent the cascading failure of the energy-water-heat nexus (Lessons from 2021).
Historical data is our most valuable asset in the design of future cities. We must use the hard-earned lessons of the past to ensure that the infrastructure of tomorrow is durable, adaptable, and capable of withstanding the next great atmospheric challenge.