


U.S. Crime Trends – 1900-2025 – Gardner Magazine Reports
Jump to a specific report on this page:
Analysis of U.S. Crime Trends: Year-End 2025 Update —–The Year the Curve Broke: 5 Surprising Truths About America’s Record Crime Decline —–The Long Arc: 125 Years of American Homicide (1900–2025) ——The Crime Data Compass: A Student’s Guide to U.S. Safety Statistics —–Strategic Assessment: 2025 Municipal Crime Trends and Lethality Analysis
Watch this Video Overview:
Listen to the “Deep Dive” about the Crime Rate in the United States on any device. CLICK PLAY.
Listen to this “DEBATE” about the Murder Rate in America on any device, CLICK PLAY.
Analysis of U.S. Crime Trends: Year-End 2025 Update

Analysis of U.S. Crime Trends: Year-End 2025 Update
Summary
As of early 2026, data from the Council on Criminal Justice (CCJ) and federal law enforcement agencies indicate an historic decline in reported crime across major United States cities. The most significant finding is a 21% reduction in homicides from 2024 to 2025, positioning the national homicide rate to reach approximately 4.0 per 100,000 residents. If finalized, this would represent the lowest homicide rate recorded in public health or law enforcement data since 1900 and the largest single-year percentage drop on record.
Of the 13 offenses tracked by the CCJ, 11 saw decreases in 2025. Violent crime overall has returned to or fallen below levels recorded in 2019, prior to the COVID-19 pandemic. While violent and property crimes have trended downward, drug offenses increased by 7% in 2025. Analysts attribute these shifts to a complex interplay of direct policy interventions, such as increased federal law enforcement surges and immigration enforcement, alongside broader social changes, including shifts in routine activities and a transition toward a cashless society.
Violent Crime Trends and Homicide Analysis
Homicide and Lethality
The decline in homicides is the primary driver of current public safety discourse. Based on data from 35 large cities, the average homicide rate fell 21% in 2025 compared to 2024.
• Historic Lows: The projected 2025 rate of 4.0 per 100,000 residents is lower than the previous record low of 4.4 in 2014. This marks a 44% decrease from the modern peak in 2021.
• Lethality Reduction: Lethality—the proportion of serious violent incidents that result in death—declined 8% between 2024 and 2025. Cities with the highest pre-pandemic homicide levels experienced the most significant drop in lethality, falling 36% since 2019. This suggests that homicides are declining at a faster rate than the underlying aggravated assaults and robberies.
• City-Level Variation: 31 of 35 studied cities reported homicide declines. Denver, Washington, D.C., and Omaha saw the largest decreases (approx. 40%). Conversely, Little Rock experienced a 16% increase.
Other Violent Offenses
Most categories of violent crime saw substantial reductions in 2025:
• Robbery and Carjacking: Robbery fell by 23%, while carjacking (a subset of robbery) plummeted by 43%.
• Assault: Aggravated assaults decreased by 9%, and gun-involved assaults dropped by 22%.
• Domestic and Sexual Violence: Domestic violence incidents fell by 2%, and sexual assault remained relatively stable compared to 2024.
Property and Non-Violent Crime Trends
The 2025 data shows a broad reversal of property crime trends that spiked during the early 2020s.
Motor Vehicle Theft
After rising consistently from 2020 through 2023, motor vehicle theft rates fell by 27% in 2025.
• Regional Contrast: Despite the national decline, motor vehicle theft in 2025 remained 9% higher than 2019 levels. New York City, in particular, has seen a 143% increase in this category since 2019.
• 2024-2025 Leaders: San Francisco and Arlington, TX, saw the largest single-year drops in vehicle theft at 45%.
Burglary and Larceny
• Residential Burglary: Fell 17% in 2025 and is currently 45% below 2019 levels.
• Nonresidential Burglary: Decreased 18% in 2025.
• Shoplifting and Larceny: Reported shoplifting declined by 10%, while broader larceny fell 11%. However, experts note that shoplifting is likely undercounted due to varying retail reporting practices.
Drug Offenses
Drug offenses were the only major category to see an increase in 2025, rising 7% over 2024 levels. Despite this recent uptick, drug crimes remain 19% below their 2019 levels.
Factors Influencing the Crime Decline
The significant reduction in crime is attributed to a combination of legislative, behavioral, and technological factors.
Policy and Law Enforcement Initiatives
• Federal Interventions: Reports highlight a “whole-of-government offensive” involving surges of federal resources into major cities. The FBI reported a 100% increase in violent crime arrests in 2025 compared to 2024.
• Targeted Task Forces: The “Make D.C. Safe and Beautiful” task force reported over 9,000 arrests and the seizure of nearly 1,000 illegal firearms.
• Immigration Enforcement: Some analysts suggest that enhanced enforcement of immigration laws and the removal of criminal illegal aliens have contributed to localized safety improvements.
• Legislative Shifts: A move away from “soft-on-crime” policies, including a rejection of certain radical district attorneys and judges, has been cited as a factor in keeping habitual offenders incarcerated.
Social and Behavioral Changes
• Routine Activity Theory: Social patterns have shifted, with individuals—particularly those aged 15-29—spending more time at home. Increased time at home generally reduces the opportunity for victimization in public spaces.
• Reduced Substance Use: Alcohol consumption among U.S. adults fell from approximately 60% in 2000-2023 to 54% in 2025. Research suggests a direct link between alcohol consumption and aggressive criminal behavior.
• Economic Digitization: The transition toward a cashless society has made individuals less attractive targets for physical robberies, as fewer people carry liquid assets.
Historical Context and Data Accuracy
Historical Comparison Caveats
While the administration and the CCJ report that the homicide rate is at a 125-year low, fact-checking entities suggest this claim is “Half True” due to historical data inconsistencies.
• 1900-1930: Data relies on public health death certificates, which count all homicides, including justifiable ones.
• 1930-1960: FBI data used different definitions and represented a smaller share of the population.
• 1960-Present: Modern methodology allows for “apples-to-apples” comparisons, confirming that 2025 is likely a 65-year low.
The “Reporting Gap”
Government statistics often present an incomplete picture:
• Victimization vs. Reporting: According to the Bureau of Justice Statistics (BJS), only 41.5% of violent crimes and 31.8% of property crimes were reported to police in 2022.
• Clearance Rates: Nationwide clearance rates (cases solved) are at their lowest levels since 1993. In 2022, police cleared only 36.7% of reported violent crimes and 12.1% of property crimes.
• Data Omissions: In 2022, approximately 32% of police departments failed to report complete crime data to the FBI, potentially leading to artificially lower national crime figures.
Public Perception
Despite documented declines, a gap remains between data and public perception. Historically, Gallup surveys show that even when crime rates fall, a majority of Americans (often 60% or more) believe crime is increasing nationally. However, Americans are generally more optimistic about safety within their own local communities. ——————————–
The Year the Curve Broke: 5 Surprising Truths About America’s Record Crime Decline
The Year the Curve Broke: 5 Surprising Truths About America’s Record Crime Decline
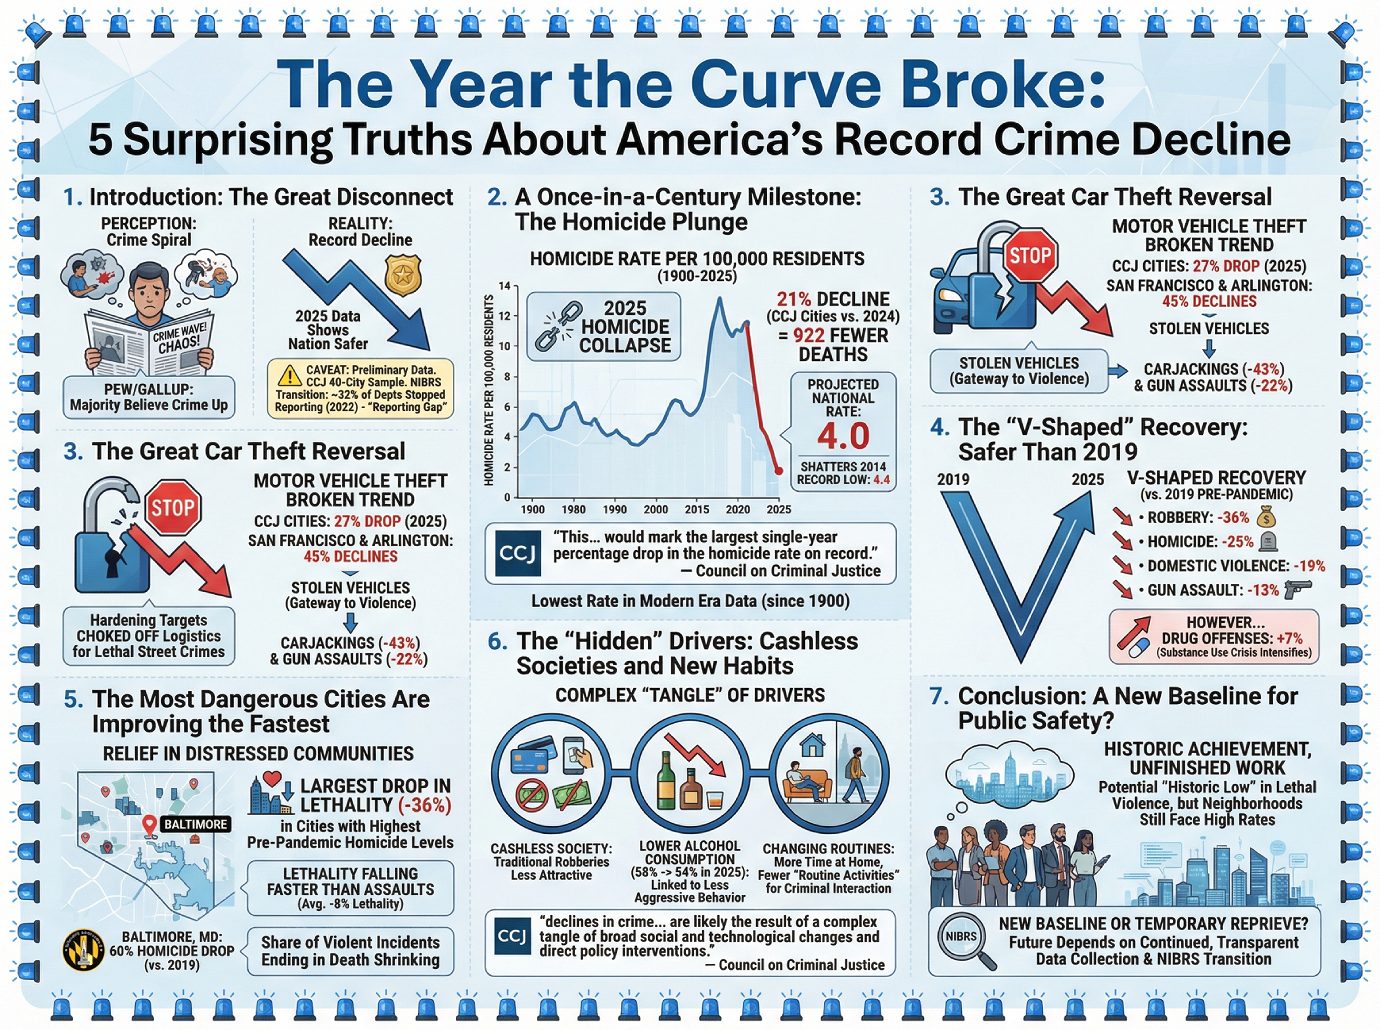
1. Introduction: The Great Disconnect There is a profound gap between what many Americans feel and what the data actually reveals. According to recent polling from Pew Research and Gallup, a majority of U.S. adults believe crime is spiraling, yet the 2025 reality suggests a total reversal of that narrative. While the headlines often focus on chaos, the numbers tell a story of a nation becoming significantly safer.
However, as an investigative journalist, I must lead with a caveat: this data is preliminary. While the Council on Criminal Justice (CCJ) reports a historic decline based on a 40-city sample, the national transition to the National Incident-Based Reporting System (NIBRS) has created a significant “reporting gap.” In fact, data from 2022 showed that 32% of police departments stopped reporting crime data to the FBI during the transition, meaning the full national picture is still being finalized.
2. A Once-in-a-Century Milestone: The Homicide Plunge The most striking figure of 2025 is the collapse of the homicide rate. In the major cities studied by the CCJ, homicides plummeted by 21% compared to 2024, representing 922 fewer deaths. If this trend holds nationally, the U.S. homicide rate is projected to hit 4.0 per 100,000 residents, shattering the previous modern-era record low of 4.4 set in 2014.
This would mark the lowest rate recorded in law enforcement or public health data going back to 1900. It signals a definitive break in the “chaos” of the pandemic-era spike.
“The rate of reported homicides was 21% lower in 2025 than in 2024… [This] would mark the largest single-year percentage drop in the homicide rate on record.” — Council on Criminal Justice
3. The Great Car Theft Reversal For years, motor vehicle theft was the outlier that refused to decline, often serving as a “gateway” for more violent offenses. That trend finally broke in 2025 as motor vehicle thefts plummeted by 27% in the study cities, with San Francisco and Arlington recording 45% declines.
This shift is a primary driver of overall safety because stolen vehicles are frequently used in high-intensity violence. As thefts fell, carjackings dropped by 43% and gun assaults plummeted by 22%. The data suggests that by hardening the targets of vehicle theft, we have inadvertently choked off the logistics for more lethal street crimes.
4. The “V-Shaped” Recovery: Safer Than 2019 Perhaps the most important benchmark is the pre-pandemic baseline of 2019. The 2025 data reveals a “V-shaped” recovery, with crime levels for most major offenses now sitting at or below 2019 levels. Consider these specific declines compared to 2019:
• Robbery: Down 36%
• Homicide: Down 25%
• Domestic Violence: Down 19%
• Gun Assault: Down 13%
However, the picture isn’t entirely rosy. While violent and property crimes fell, drug offenses were the only category to increase, rising by 7% in 2025. This suggests that while streets are becoming less physically violent, the underlying crisis of substance use continues to intensify.
5. The Most Dangerous Cities Are Improving the Fastest One of the most encouraging findings is that relief is being felt most in the communities previously most “distressed” by violence. Cities with the highest pre-pandemic homicide levels experienced the largest drop in lethality (-36%) compared to 2019. On average, lethality fell by 8% across all study cities from 2024 to 2025, meaning homicides are declining faster than the underlying assaults.
The turnaround in Baltimore, MD, serves as the primary example. Once a symbol of high-crime urban struggles, Baltimore saw a 60% drop in homicides in 2025 compared to 2019 levels. This indicates that the share of violent incidents ending in death is finally shrinking, providing significant relief to the most vulnerable neighborhoods.
6. The “Hidden” Drivers: Cashless Societies and New Habits Why is this happening? Beyond policy shifts, researchers point to a “complex tangle” of social and technological factors. One compelling theory involves our transition into a cashless society, which makes traditional robberies less attractive. Furthermore, behavioral data shows a significant drop in alcohol consumption, falling from 58% to 54% in 2025, a shift historically linked to lower rates of aggressive behavior.
Additionally, daily routines have changed. Americans are spending more time at home or alone than in previous decades, reducing the “routine activities” that create opportunities for criminal interaction. While these shifts improve safety, they represent a fundamental change in how Americans interact with their communities.
“Determining a cause for the decline requires a rigorous examination… the declines in crime, especially homicide, are promising, and are likely the result of a complex tangle of broad social and technological changes and direct policy interventions.” — Council on Criminal Justice
7. Conclusion: A New Baseline for Public Safety? The 2025 data marks a historic achievement, bringing the country to a potential “historic low” in lethal violence. However, the work remains unfinished, as many neighborhoods still face rates of violence that exceed those of our international peers.
As we move toward a future defined by digital transactions and changing social routines, we must ask: As we move toward a future of digital transactions and changing social routines, have we fundamentally changed the math of American crime, or is this just a temporary reprieve? Only continued, transparent data collection—free from the reporting gaps of the NIBRS transition—will tell the final story.
The Long Arc: 125 Years of American Homicide (1900–2025)
The Long Arc: 125 Years of American Homicide (1900–2025)
1. Introduction: Understanding the Historical Pulse
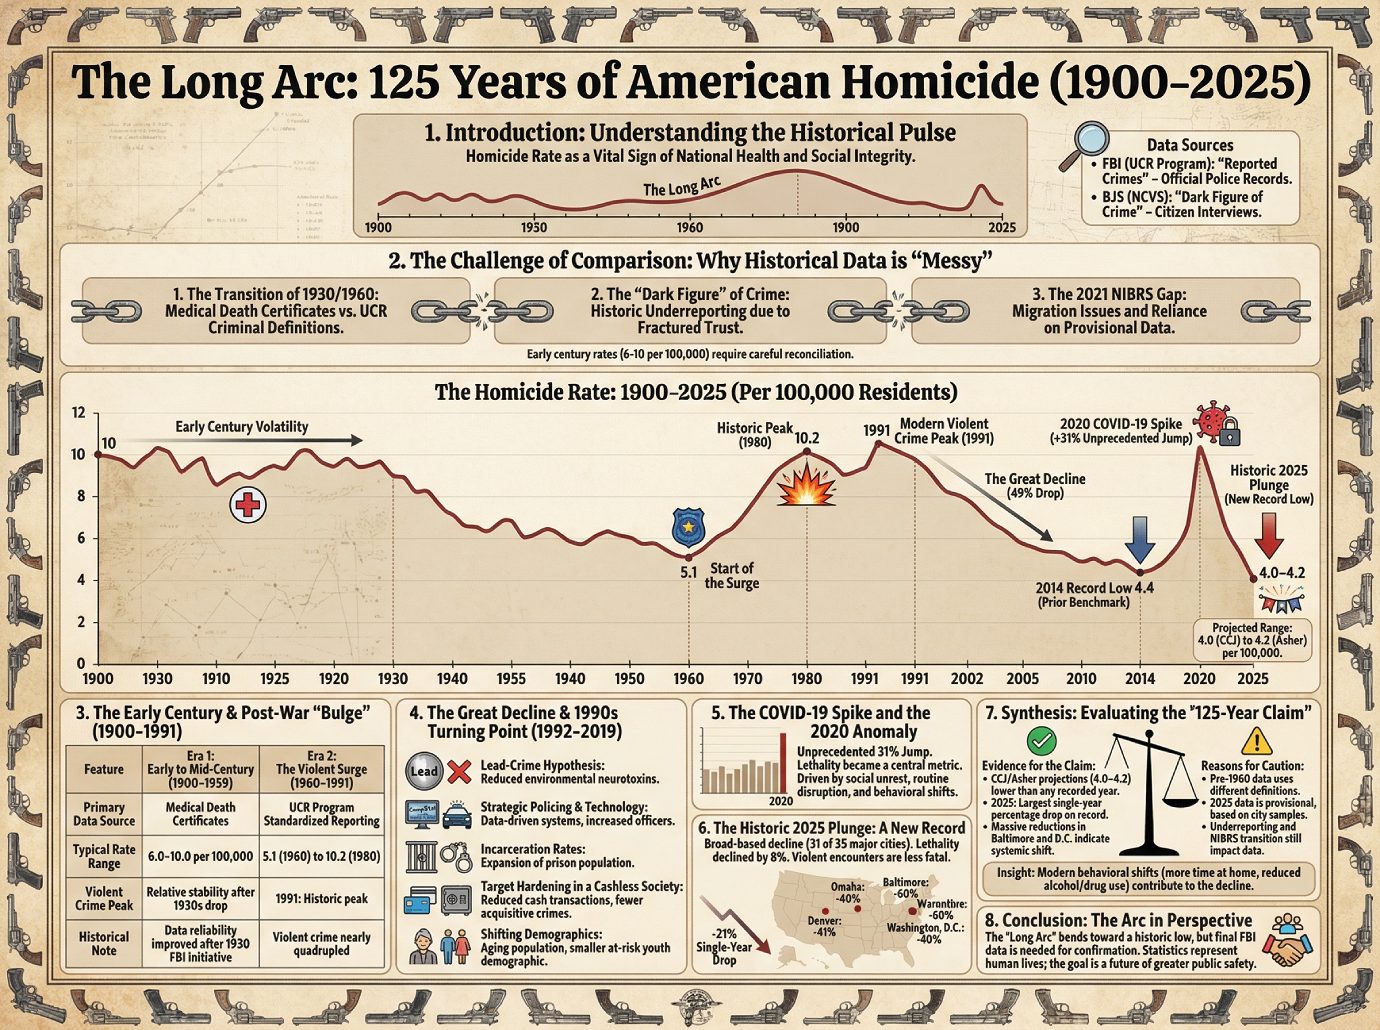
In the field of longitudinal analysis, the homicide rate is more than a statistic; it is a vital sign of national health and the structural integrity of the social contract. For over a century, the United States has navigated a volatile landscape of violence, from the lawlessness of the early 20th century to the post-war surges that redefined urban policy. As we synthesize the data through the close of 2025, we find ourselves at a remarkable juncture: newly released figures suggest that after 125 years of variance, the American homicide rate has plunged to an unprecedented historical low.
To architect an accurate narrative of this decline, we must first define our primary instruments of measurement. Modern criminology relies on two distinct government data sets:
• The Federal Bureau of Investigation (FBI): Operating through the Uniform Crime Reporting (UCR) Program, this agency captures “reported crimes”—incidents known to and recorded by law enforcement. It remains the official record for clearing cases and tracking arrests.
• The Bureau of Justice Statistics (BJS): Utilizing the National Crime Victimization Survey, the BJS identifies the “dark figure of crime” by interviewing citizens directly. This captures offenses that, for various reasons, never entered the official police ledger.
2. The Challenge of Comparison: Why Historical Data is “Messy”
Reconciling homicide data from 1900 with modern 2025 records requires the meticulous cleansing of vital statistics. As a data architect, I must note three specific hurdles that complicate any direct longitudinal comparison:
• The Transition of 1930/1960: Prior to the formalization of the Uniform Crime Reporting (UCR) Program in 1930—and its modern standardization in 1960—homicide data was largely derived from medical death certificates. These public health records often utilized broader definitions of “homicide” than the specific criminal “murder” classifications used by the FBI today.
• The “Dark Figure” of Crime: Historically, underreporting was rampant due to fractured trust between communities and authorities. Without the victimization surveys we have today, the true experience of violence in the early 1900s remains a calculated estimate rather than a definitive count.
• The 2021 NIBRS Gap: The recent transition to the National Incident-Based Reporting System (NIBRS) initially created a significant “blind spot.” In 2021, nearly a third of law enforcement agencies failed to successfully migrate their data, forcing researchers to rely on provisional data sets and statistical modeling to bridge the gap.
These architectural hurdles make the early century rates—which fluctuated between 6 and 10 per 100,000 residents—a baseline that requires careful reconciliation before comparing them to our contemporary “record-breaking” era.
3. The Early Century and the Post-War “Bulge” (1900–1991)
From 1900 through the mid-1930s, homicide rates remained elevated and volatile, often hovering near 10 per 100,000. However, the most significant shift began in 1960. The following three decades saw a massive surge in violence, where the homicide rate eventually hit a historic peak of 10.2 per 100,000 in 1980. This era of high variance reached its ultimate culmination in 1991, marked as the peak of the modern violent crime wave.
Historical Comparison of Crime Eras
| Feature | Era 1: Early to Mid-Century (1900–1959) | Era 2: The Violent Surge (1960–1991) |
|---|---|---|
| Primary Data Source | Medical Death Certificates / Vital Stats | UCR Program Standardized Reporting |
| Typical Rate Range | 6.0 – 10.0 per 100,000 residents | 5.1 (1960) to 10.2 (1980) |
| Violent Crime Peak | Relative stability after the 1930s drop. | 1991: The historic peak for all violent crime. |
| Historical Note | Data reliability improved following the 1930 FBI initiative. | Violent crime nearly quadrupled during this period. |
Just as the nation braced for an unstoppable upward trajectory in violence, the “long arc” took a sudden, massive turn toward a new era of relative safety.
4. The Great Decline and the 1990s Turning Point (1992–2019)
Beginning in 1992, the United States entered the “Great Decline,” a period where violent crime plummeted by roughly 49% between 1993 and 2022. This shift fundamentally altered our understanding of urban stability.
Criminologists have identified five primary drivers for this decline:
1. The Lead-Crime Hypothesis: Evidence suggests that removing lead from gasoline and paint reduced environmental neurotoxins that drive impulsive and aggressive behavior.
2. Strategic Policing and Technology: The rise of data-driven systems like CompStat and a massive increase in the number of officers employed in the 1990s.
3. Incarceration Rates: A significant expansion of the prison population removed repeat offenders from the street, though the social cost remains a subject of intense debate.
4. Target Hardening in a Cashless Society: As digital transactions replaced physical currency, “acquisitive crimes” like robbery became more difficult. This is critical because it reduced the frequency of violent confrontations that typically escalate into homicides.
5. Shifting Demographics: An aging population proved a natural deterrent; as the “at-risk” youth demographic shrank, the statistical likelihood of violent outbursts fell.
Significance of the 2014 Low: Prior to the current 2025 shift, 2014 served as the primary benchmark for the modern era, with the homicide rate reaching a record low of 4.4 per 100,000 residents.
The steady descent of the Great Decline was not eroded by time, but shattered by the global upheaval of 2020.
5. The COVID-19 Spike and the 2020 Anomaly
In 2020, the U.S. experienced an “unprecedented” 31% jump in homicides—the largest single-year increase since records began in 1900. The Council on Criminal Justice (CCJ) attributes this to a “complex tangle” of factors, including social unrest, the disruption of routine activities, and behavioral shifts during lockdowns.
During this period, the criminological concept of Lethality—the share of serious violent crimes that result in death—became a central metric. As social systems strained, violence became more fatal. However, as the pandemic-era variance stabilized, the nation began a descent into a new, historic territory.
6. The Historic 2025 Plunge: A New Record
According to the latest Year-End 2025 Update from the CCJ, the U.S. witnessed a staggering 21% single-year drop in homicides. This decline was broad-based, affecting 31 of the 35 major cities providing data, representing 922 fewer homicides than the previous year in those jurisdictions alone. Furthermore, the lethality of violent crime declined by 8% from 2024 to 2025, indicating that violent encounters are increasingly less fatal.
Insight: The 4.0 – 4.2 Projection
The 2025 national homicide rate is projected to fall to a range between 4.0 (CCJ) and 4.2 (Asher) per 100,000 residents. This range represents the lowest homicide rate in recorded U.S. history, finally dipping below the 2014 record of 4.4 and surpassing the relative lows of the early 1900s.
The local impact of this trend is highlighted by dramatic declines in major hubs:
• Baltimore, MD: -60% (from its 2019 peak)
• Denver, CO: -41%
• Washington, D.C.: -40% (with some reports indicating up to 60% during specific enforcement surges)
• Omaha, NE: -40%
These preliminary findings have reignited the debate over the validity of the “125-year” claim.
7. Synthesis: Evaluating the “125-Year Claim”
Objectively assessing whether 2025 is the safest year since 1900 requires weighing provisional data against historical reporting methods.
| Evidence for the Claim | Reasons for Caution |
|---|---|
| CCJ/Asher projections (4.0–4.2) are lower than any recorded year in UCR or vital stats history. | Pre-1960 data uses different architectural definitions (medical vs. criminal). |
| 2025 represents the largest single-year percentage drop on record. | 2025 data remains “provisional” and is based on a sample of large cities. |
| Baltimore and D.C. have seen massive reductions, indicating a broad systemic shift. | Underreporting and the transition to NIBRS still impact data completeness. |
Beyond policy, behavioral shifts are a modern driver of this decline. Grounded in “Routine Activity Theory,” the source suggests that all crimes require opportunity. As modern Americans spend significantly more time at home, the likelihood of victimization decreases. Furthermore, alcohol consumption—a primary driver of aggression—hit a new low of 54% in 2025, while a decline in overdose deaths indicates reduced street drug market activity, further cooling the traditional “hot spots” of urban violence.
8. Conclusion: The Arc in Perspective
The 2025 numbers are heartening, suggesting the “long arc” of American homicide is currently bending toward a historic low. However, as senior criminologists, we must remain disciplined. Historians and scientists require the final, standardized data from the FBI’s full national reports to confirm these shifts with absolute certainty.
While the data points are promising, we must remember that statistics are the ghosts of human lives. Every percentage point representing a decline in homicide is a community restored and a family spared. The ultimate goal of this 125-year longitudinal study is to utilize these insights to move toward a future of greater public safety for all. —————————————
The Crime Data Compass: A Student’s Guide to U.S. Safety Statistics
The Crime Data Compass: A Student’s Guide to U.S. Safety Statistics
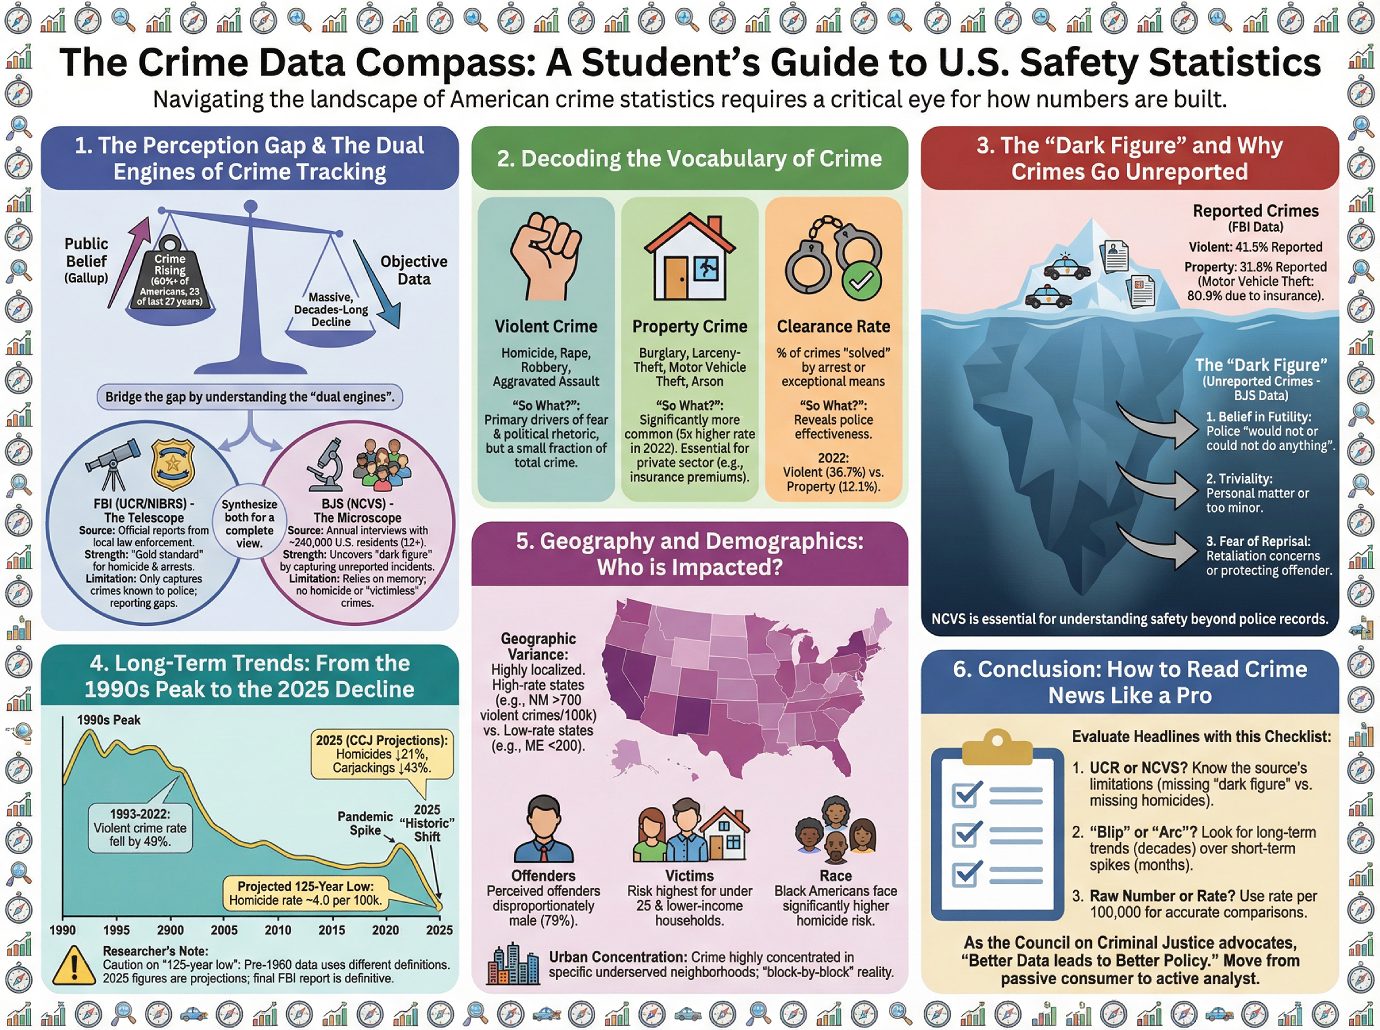
Navigating the landscape of American crime statistics requires more than just reading numbers; it requires a critical eye for how those numbers are built. As a student of criminology, you must reconcile a persistent “perception gap” in public discourse. Gallup surveys reveal that in 23 of the last 27 years, more than 60% of Americans believed crime was rising nationally, even as objective data showed a massive, decades-long decline. To bridge the gap between headlines and reality, we must understand the “dual engines” that power our national data.
1. The Dual Engines of Crime Tracking
The U.S. government uses two primary systems to measure crime. Think of these as a telescope and a microscope: the Federal Bureau of Investigation (FBI) looks at what the police see, while the Bureau of Justice Statistics (BJS) looks at what victims experience.
| Feature | Uniform Crime Reporting (UCR/NIBRS) | National Crime Victimization Survey (NCVS) |
|---|---|---|
| Source of Data | Official reports submitted voluntarily by local law enforcement agencies. | Annual interviews with a representative sample of ~240,000 U.S. residents (ages 12+). |
| Primary Strength | The “gold standard” for tracking homicide (since victims cannot be interviewed) and arrests. | Uncovers the “dark figure of crime” by capturing incidents never reported to the police. |
| Key Limitation | Only captures crimes known to police; subject to reporting gaps from local agencies. | Relies on victim memory; cannot track homicide or “victimless” crimes like drug use. |
Transitional Sentence: Because neither engine provides a complete view of the American landscape, researchers must synthesize both to account for the massive amount of crime that never enters a police ledger.
2. Decoding the Vocabulary of Crime
To evaluate crime claims, you must master the legal “bins” into which incidents are sorted. Definitions are not just semantic; they dictate how resources are allocated.
• Violent Crime: This index includes four specific offenses: homicide, rape, robbery, and aggravated assault. The “So What?”: These crimes are the primary drivers of public fear and dominate political rhetoric, yet they represent a small fraction of total criminal activity.
• Property Crime: This category covers burglary, larceny-theft, motor vehicle theft, and arson. The “So What?”: These offenses are significantly more common than violent crimes. In 2022, property crime rates were over five times higher than violent crime rates. This data is essential for the private sector; for example, insurance companies use larceny and motor vehicle theft rates to set premiums in specific zip codes.
• Clearance Rate: This represents the percentage of crimes “solved” by arrest or exceptional means (e.g., the suspect died). The “So What?”: Clearance success reveals where police resources are most effective. In 2022, there was a stark divide: police cleared 36.7% of violent crimes but only 12.1% of property crimes.
Transitional Sentence: While these categories help us organize the data we have, our biggest challenge as researchers is understanding the data we are missing.
3. The “Dark Figure” and Why Crimes Go Unreported
The “dark figure of crime” is the gap between actual crime and the crimes reported in FBI statistics. The BJS reminds us that “better data” requires acknowledging that most victims never call 911.
The three most common reasons for non-reporting include:
1. Belief in Futility: The victim believes the police “would not or could not do anything to help.”
2. Triviality: The incident is viewed as a personal matter or too minor to warrant official intervention.
3. Fear of Reprisal: Concerns about retaliation from the offender or a desire to protect an offender known to the victim.
Only a fraction of criminal victimizations reach law enforcement:
• Violent Crimes Reported: 41.5%
• Property Crimes Reported: 31.8% | Researcher’s Note: Motor vehicle theft has the highest reporting rate (80.9%) because most insurance policies require a police report to process a claim.
Transitional Sentence: This reporting gap is the primary reason why victim surveys like the NCVS are essential for understanding national safety beyond the limits of police records.
4. Long-Term Trends: From the 1990s Peak to the 2025 Decline
Students must avoid “snapshot bias”—the tendency to view a single year’s spike as a permanent new reality. To understand the current landscape, we must look at the long-term arc.
• The 1990s Turning Point: U.S. crime reached a historic peak in the early 1990s. Between 1993 and 2022, the violent crime rate fell by 49%.
• The 2025 “Historic” Shift: Following a volatile spike in homicides during the 2020 pandemic, current data indicates a massive reversal. According to the Council on Criminal Justice (CCJ), 2025 saw a 21% drop in homicides and a 43% drop in carjackings.
• The 125-Year Context: Researchers project the 2025 homicide rate may fall to 4.0 per 100,000 people. If confirmed, this would be the lowest rate in recorded U.S. history.
Researcher’s Note on Methodology: Be cautious when citing the “125-year low” claim. Comparisons prior to 1960 are difficult because they rely on public health death certificates (which included justifiable killings) rather than the FBI’s Crime in the United States (CIUS) series (which uses strict law enforcement definitions). Furthermore, 2025 figures are projections based on city samples; the final national “truth” isn’t settled until the FBI releases its full year-end report.
Transitional Sentence: While these national declines are historic, the data also reveals that crime is not distributed evenly across the map.
5. Geography and Demographics: Who is Impacted?
Risk is not a national average; it is a product of location and identity.
• Geographic Variance: Crime rates are highly localized. In 2022, high-rate states like New Mexico reported over 700 violent crimes per 100,000 people, while low-rate states like Maine reported fewer than 200.
• Demographic Insights:
◦ Offenders: Perceived offenders are disproportionately male (79%).
◦ Victims: BJS data shows that risk is highest for those under 25 and those living in lower-income households.
◦ Race: While overall victimization rates are similar across many groups, Black Americans face a significantly higher risk of homicide victimization than other racial groups.
• The “Urban Concentration” Reality: Crime is rarely uniform across a city. Instead, it is highly concentrated in specific underserved, economically disadvantaged neighborhoods. Safety is often a “block-by-block” reality where localized social dynamics and lack of investment—rather than city-wide policy—drive the numbers.
Transitional Sentence: Understanding these nuances helps us avoid common misconceptions often found in media coverage.
6. Conclusion: How to Read Crime News Like a Pro
To evaluate “crime wave” headlines like a trained criminologist, apply this final checklist to any data you encounter:
1. Is this based on the UCR or the NCVS? Remember that police reports (UCR) miss the “dark figure,” while surveys (NCVS) miss homicides.
2. Is the trend a “blip” or an “arc”? Does the report compare this month to last month (highly volatile), or does it look at the decades-long decline since the 1990s?
3. Is it a raw number or a rate? Raw numbers always increase as populations grow. Only the rate per 100,000 people allows for an “apples-to-apples” comparison between a small town and a major city.
As the Council on Criminal Justice advocates, “Better Data leads to Better Policy.” By mastering these mental models, you move from being a passive consumer of news to an active analyst of public safety. ————————————
Strategic Assessment: 2025 Municipal Crime Trends and Lethality Analysis
Strategic Assessment: 2025 Municipal Crime Trends and Lethality Analysis
1. Strategic Context and Historical Benchmark (1900–2025)
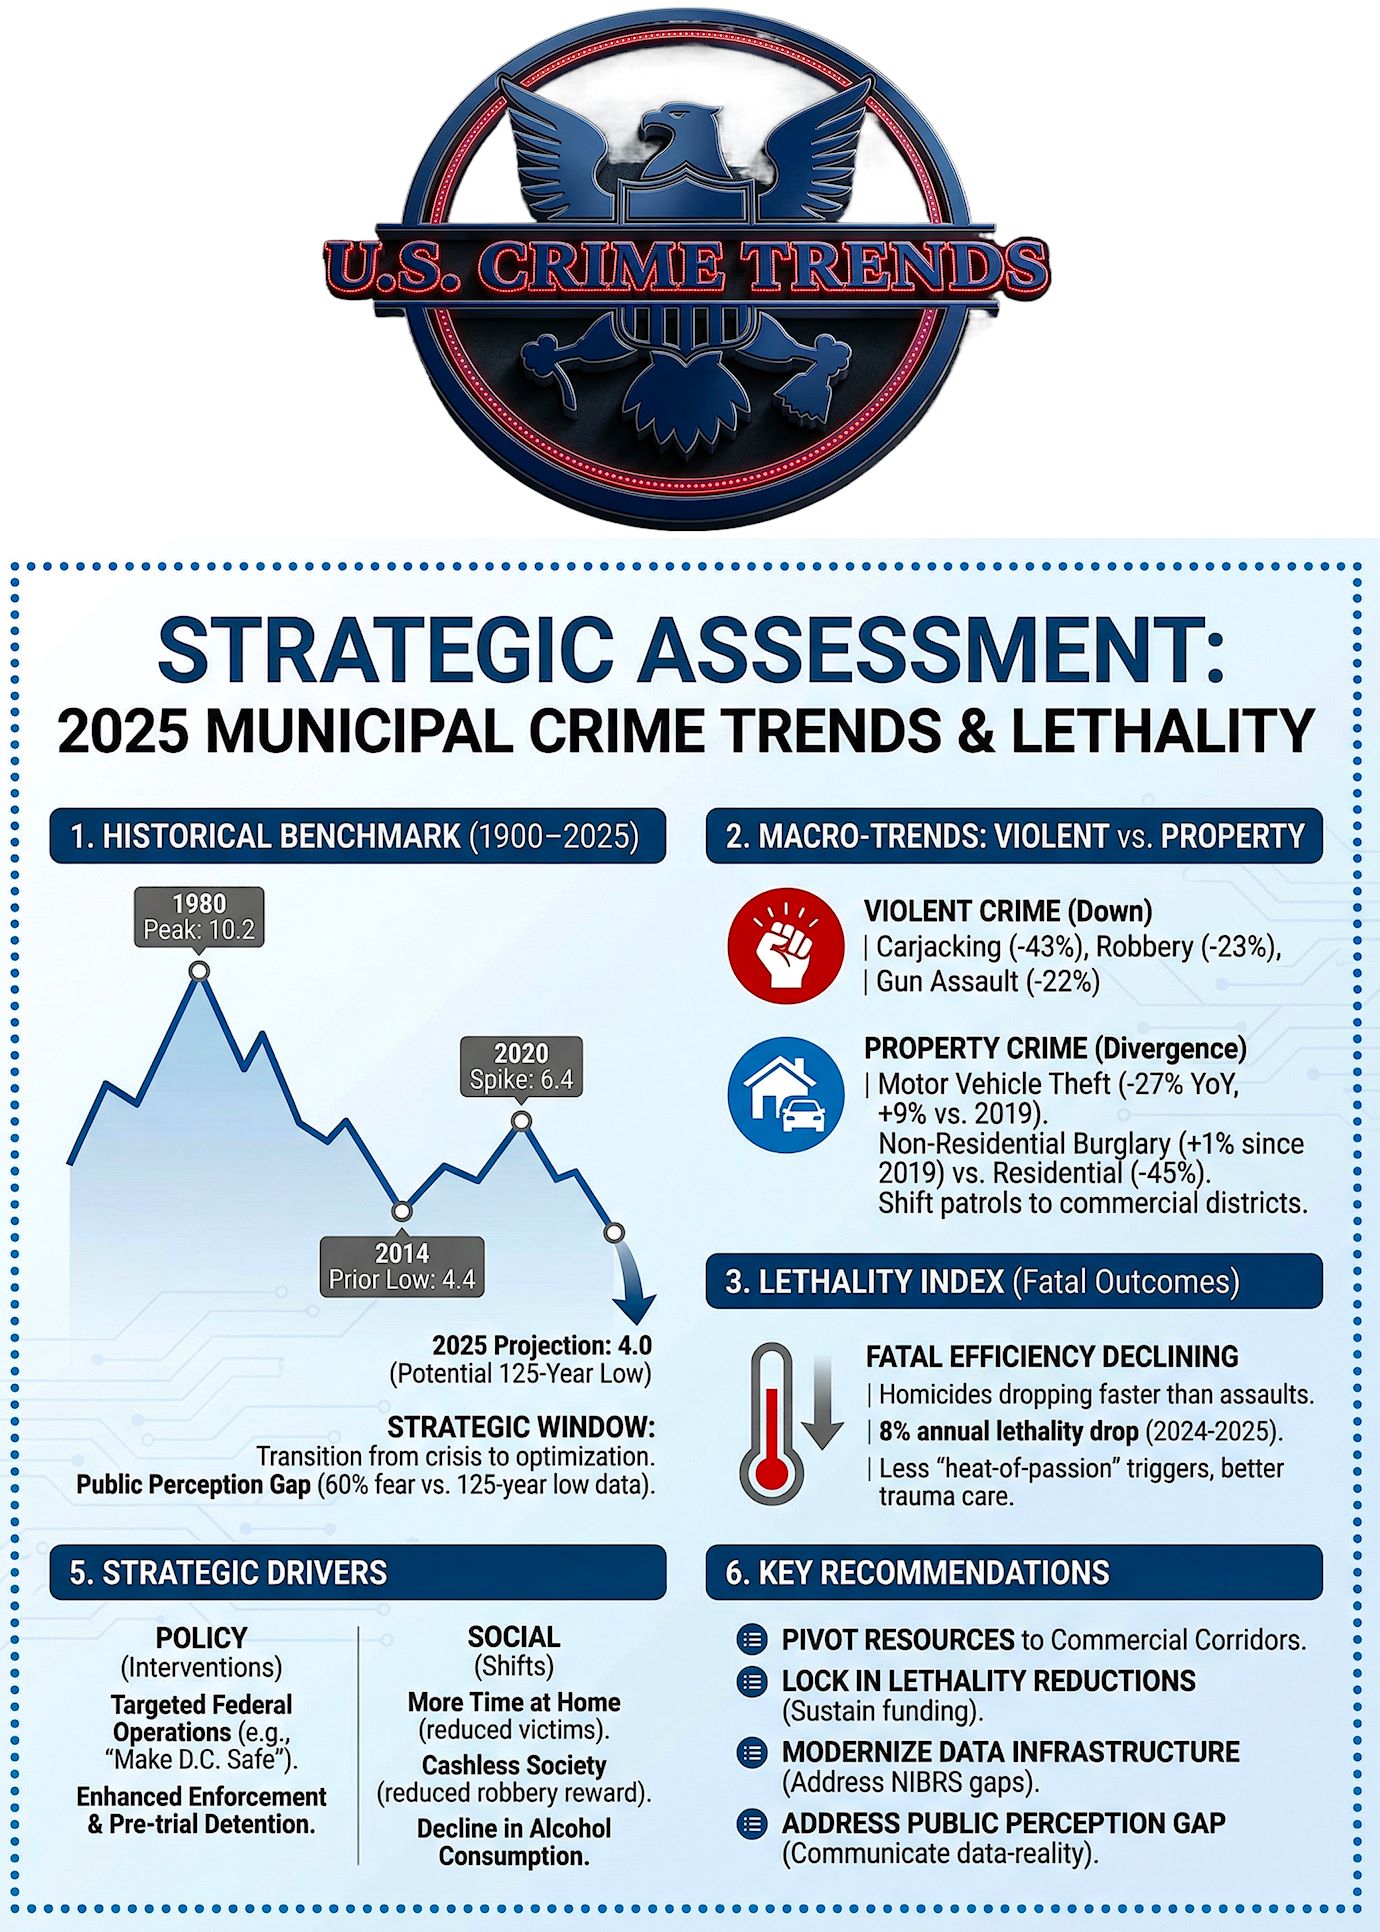
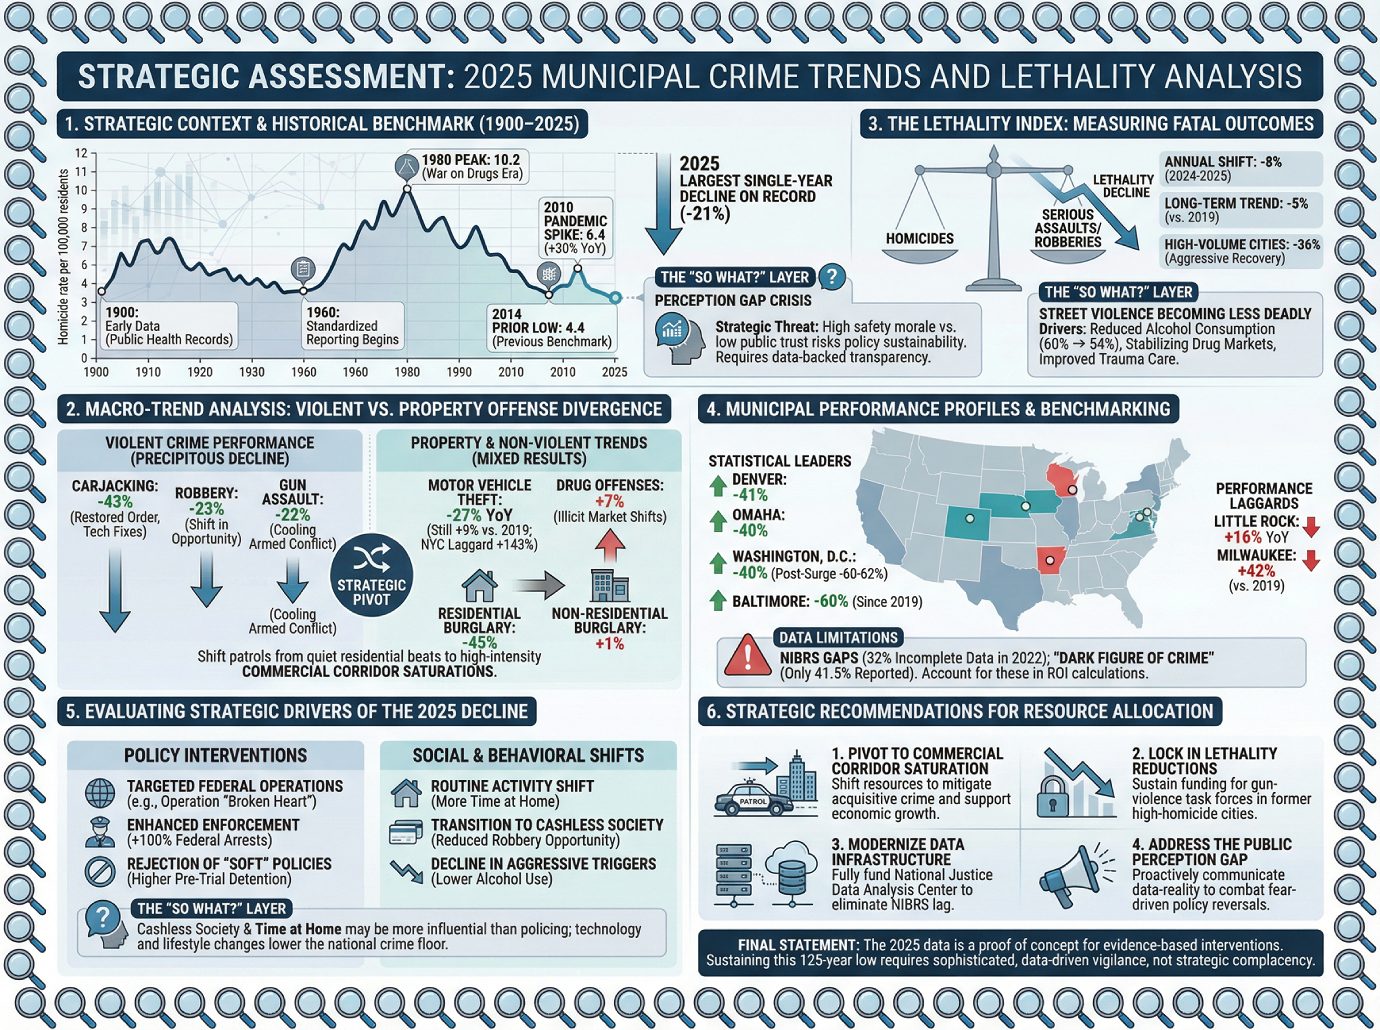
The 2025 crime data constitutes a pivotal historical pivot, marking a definitive retreat from the pandemic-era volatility. Current projections indicate a national homicide rate of approximately 4.0 per 100,000 residents—a figure representing a potential 125-year low. For municipal and federal leadership, this provides a critical strategic window to transition from crisis management to evidence-based optimization. However, a professional caveat is required: historical data prior to 1960 relied on public health records and death certificates rather than standardized law enforcement reporting. Consequently, while the 2025 projection likely represents a secular low, precise “apples-to-apples” comparisons with the pre-1960 era are subject to methodological variances.
The table below contextualizes the 2025 projection within the broader arc of American public safety:
| Era / Benchmark | Homicide Rate (per 100,000) | Contextual Significance |
|---|---|---|
| 1980 Peak | 10.2 | The modern historical high; height of the “war on drugs” era. |
| 2014 Prior Low | 4.4 | The previous modern benchmark for national safety. |
| 2020 Pandemic Spike | 6.4 | An unprecedented 30% single-year increase in lethality. |
| 2025 Projection | 4.0 | Potential 125-year low and largest single-year decline on record. |
The “So What?” Layer The 21% year-over-year homicide drop—the largest single-year decline ever recorded—dismantles the narrative of a permanent post-pandemic crime wave. Strategically, however, we face a “perception gap” crisis: while data shows a 125-year low, Gallup and Pew research indicates approximately 60% of the public believes crime is rising. This dissonance is a strategic threat; if public safety morale is high but public trust is low, the sustainability of effective policies is at risk. We must move beyond reporting numbers to managing public perception through data-backed transparency.
This national trend provides the framework for analyzing the specific longitudinal variance observed across our 40-city sample.
——————————————————————————–
2. Macro-Trend Analysis: Violent vs. Property Offense Divergence
To optimize resource allocation, strategists must reject “one-size-fits-all” policing. The 2025 data reveals a significant divergence between violent and property offenses, requiring specialized tactical responses.
Violent Crime Performance High-harm violent offenses have seen a precipitous decline across the 2025 study sample:
• Carjacking (-43%): This is a primary indicator of restored street-level order. The drop is largely driven by a cooling of the “Kia/Hyundai” technological theft trend and the saturation of high-risk corridors.
• Robbery (-23%): Significant reductions reflect a fundamental shift in criminal opportunity structures.
• Gun Assault (-22%): Closely tracking the homicide decline, this suggests a general cooling of armed conflict in municipal centers.
Property and Non-Violent Trends While motor vehicle theft saw a 27% YoY decline, it remains 9% higher than 2019 levels. Some jurisdictions remain significant laggards; most notably, New York experienced a staggering 143% increase in motor vehicle theft relative to 2019. Conversely, drug offenses represent the only category to rise in 2025 (+7%), likely reflecting shifts in illicit street market enforcement.
The “So What?” Layer The divergence between residential burglary (-45% since 2019) and non-residential burglary (+1% since 2019) indicates a fundamental shift in “routine activity.” As individuals spend more time at home, criminal opportunity has migrated from residential neighborhoods to commercial districts. For city leaders, this necessitates a strategic pivot: shifting patrols from quiet residential beats to high-intensity commercial corridor saturations to support urban revitalization.
——————————————————————————–
3. The Lethality Index: Measuring the Fatal Outcomes of Violence
The ‘Lethality Index’—the ratio of homicides to serious non-fatal assaults and robberies—serves as a critical diagnostic of the severity of violence. It measures the “fatal efficiency” of street conflict, providing a metric independent of total incident volume.
Lethality Metrics (2019–2025)
• Annual Shift: average lethality declined by 8% from 2024 to 2025.
• Long-term Trend: Lethality is now 5% lower than in 2019.
• High-Volume Cities: Jurisdictions with the highest pre-pandemic homicide levels saw the most aggressive recovery, with a 36% drop in lethality.
The “So What?” Layer Homicides are declining at a faster rate than aggravated assaults, meaning street violence is becoming less deadly. This reduction in “fatal efficiency” is not accidental. Strategic analysis credits this to a “complex web” of behavioral shifts: a decline in alcohol consumption (from 60% to 54% of adults) and stabilizing illicit drug markets have reduced the “heat-of-passion” triggers that escalate assaults into murders. Combined with improvements in trauma care, these factors have curtailed the lethality of municipal conflict.
——————————————————————————–
4. Municipal Performance Profiles and Comparative Benchmarking
City-specific benchmarking allows us to isolate statistical outliers and identify jurisdictions requiring urgent federal or state intervention.
The 2025 Leaders and Laggards
• Statistical Leaders: Denver (-41%), Omaha (-40%), and Washington, D.C. led the nation in homicide reductions. In D.C., while the annual drop was 40%, post-surge data following the “Make D.C. Safe and Beautiful” task force showed homicides down as much as 60-62%.
• Longitudinal Standard: Baltimore continues its exceptional recovery, with a 60% reduction in homicides since 2019.
• Performance Laggards: Little Rock (+16% YoY) and Milwaukee (+42% vs. 2019) remain significant outliers to the national cooling trend.
The “So What?” Layer We must clinicaly acknowledge the limitations of this data. The transition to the National Incident-Based Reporting System (NIBRS) has resulted in significant gaps; in 2022, 32% of departments failed to report complete data. Furthermore, official figures only capture the 41.5% of violent crimes reported to police. Strategists must account for this “dark figure of crime” and the preliminary nature of 2025 figures when calculating the ROI of safety interventions.
——————————————————————————–
5. Evaluating the Strategic Drivers of the 2025 Decline
The 2025 decline is the result of an interplay between aggressive policy and profound social shifts.
| Policy Interventions | Social & Behavioral Shifts |
|---|---|
| Targeted Federal Operations: High-impact surges like Operation “Broken Heart” and the “Make D.C. Safe and Beautiful” task force focused on violent fugitives and gang takedowns. | Routine Activity Shift: A significant driver is that people—particularly young people—are spending more time at home (Ref: CCJ Figure 21), reducing the volume of potential street victims. |
| Enhanced Enforcement: Surging federal arrests (up 100% YoY) and aggressive removal of criminal illegal aliens have disrupted high-rate offending cycles. | Transition to Cashless Society: The shift to digital transactions has caused the risk-reward ratio for street robbery (-36% since 2019) to collapse as physical “loot” disappears. |
| Rejection of “Soft” Policies: National pushback against radical district attorneys has led to higher pre-trial detention rates for violent offenders. | Decline in Aggressive Triggers: Alcohol consumption fell from 60% to 54%, reducing the pharmacological drivers of “heat-of-passion” violence. |
The “So What?” Layer The “Cashless Society” and “Time at Home” factors may be more influential in reducing volume than any single policing tactic. If the opportunity for crime is removed by technology and lifestyle changes, the floor for national crime rates naturally lowers.
——————————————————————————–
6. Strategic Recommendations for Public Safety Resource Allocation
To maintain momentum into 2026, resource allocation must shift from reactive broad-based spending to targeted, data-driven investments.
1. Pivot to Commercial Corridor Saturation: With residential burglary down 45% but non-residential burglary stagnant, cities should shift patrol resources from residential neighborhoods to commercial business districts to mitigate “acquisitive crime” and support economic growth.
2. Lock in Lethality Reductions: Maintain high-intensity interdiction in former high-homicide cities. The 36% lethality drop is fragile; sustained funding for gun-violence task forces is essential to prevent violence from regaining its “fatal efficiency.”
3. Modernize Data Infrastructure: To eliminate the “NIBRS lag,” Congress and municipal leaders must fully fund the National Justice Data Analysis Center. Strategic blindness is the greatest threat to effective budgeting.
4. Address the Public Perception Gap: Leaders must proactively communicate the “data-reality” to combat the 60% perception of rising crime. Public fear can drive inefficient, knee-jerk policy reversals that undermine evidence-based progress.
Final Statement: The 2025 data serves as a proof of concept for evidence-based interventions and a reminder that while the era of pandemic-induced lawlessness is over, sustaining this 125-year low requires sophisticated, data-driven vigilance rather than strategic complacency.