


Education – Massachusetts – Tops in the Nation – Reports by Gardner Magazine
A series of reports on Education in Massachusetts
Jump to a section: Why Massachusetts is Tops in Education —– Beyond the Zip Code: Decoding the “Massachusetts Miracle” and the Great American Education Divide —–Regional Benchmarking Analysis: Education as the Catalyst for Economic Resilience and Growth
VIDEO – Click PLAY or go FULL SCREEN.
Listen to a “Deep Dive” podcast on any device. CLICK PLAY.
Why Massachusetts is Tops in Education
Why Massachusetts is Tops in Education
Gardner Magazine Summary
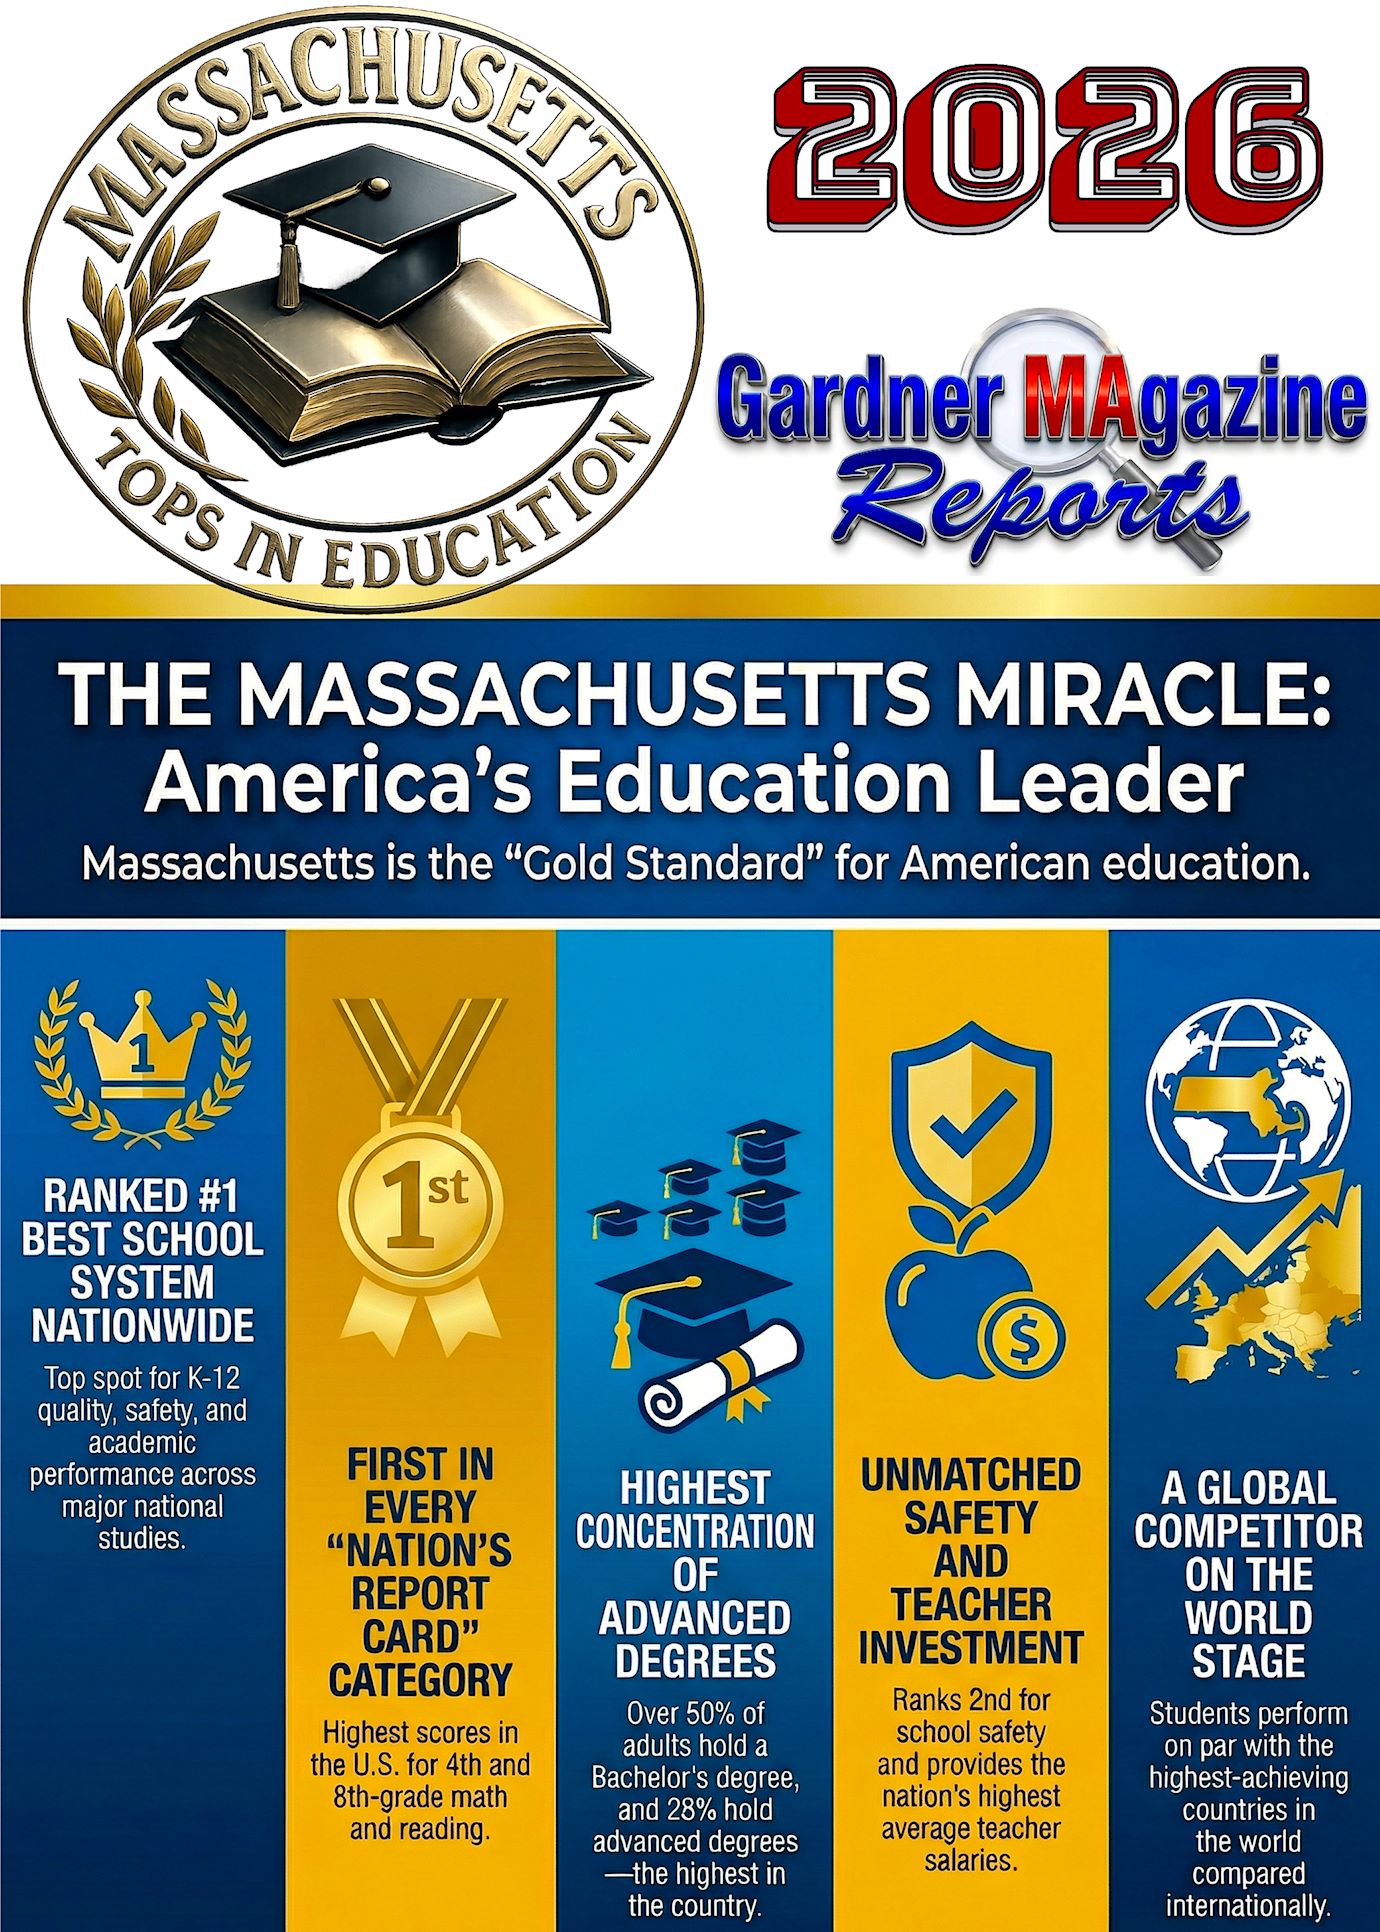
Massachusetts consistently distinguishes itself as the premier state for education in the United States, frequently securing the #1 ranking in K-12 achievement, higher education attainment, and overall literacy. This “Massachusetts Miracle” is characterized by nation-leading performance on the National Assessment of Educational Progress (NAEP), where the state has swept the top scores in 4th and 8th-grade math and reading. Beyond domestic comparisons, Massachusetts students compete effectively on an international scale, often outperforming major global economies in science and reading. This success is underpinned by high per-pupil funding, the highest average teacher salaries in the nation, and a structural commitment to rigorous, consistent academic standards. While the state faces ongoing challenges regarding pandemic-era learning loss—particularly in reading—it has responded with aggressive early literacy initiatives and targeted efforts to reduce chronic absenteeism.
——————————————————————————–
National and International Academic Performance
Massachusetts maintains a dominant position in standardized testing across multiple metrics, confirming a high standard of academic excellence from primary through secondary school.
The “Nation’s Report Card” (NAEP)
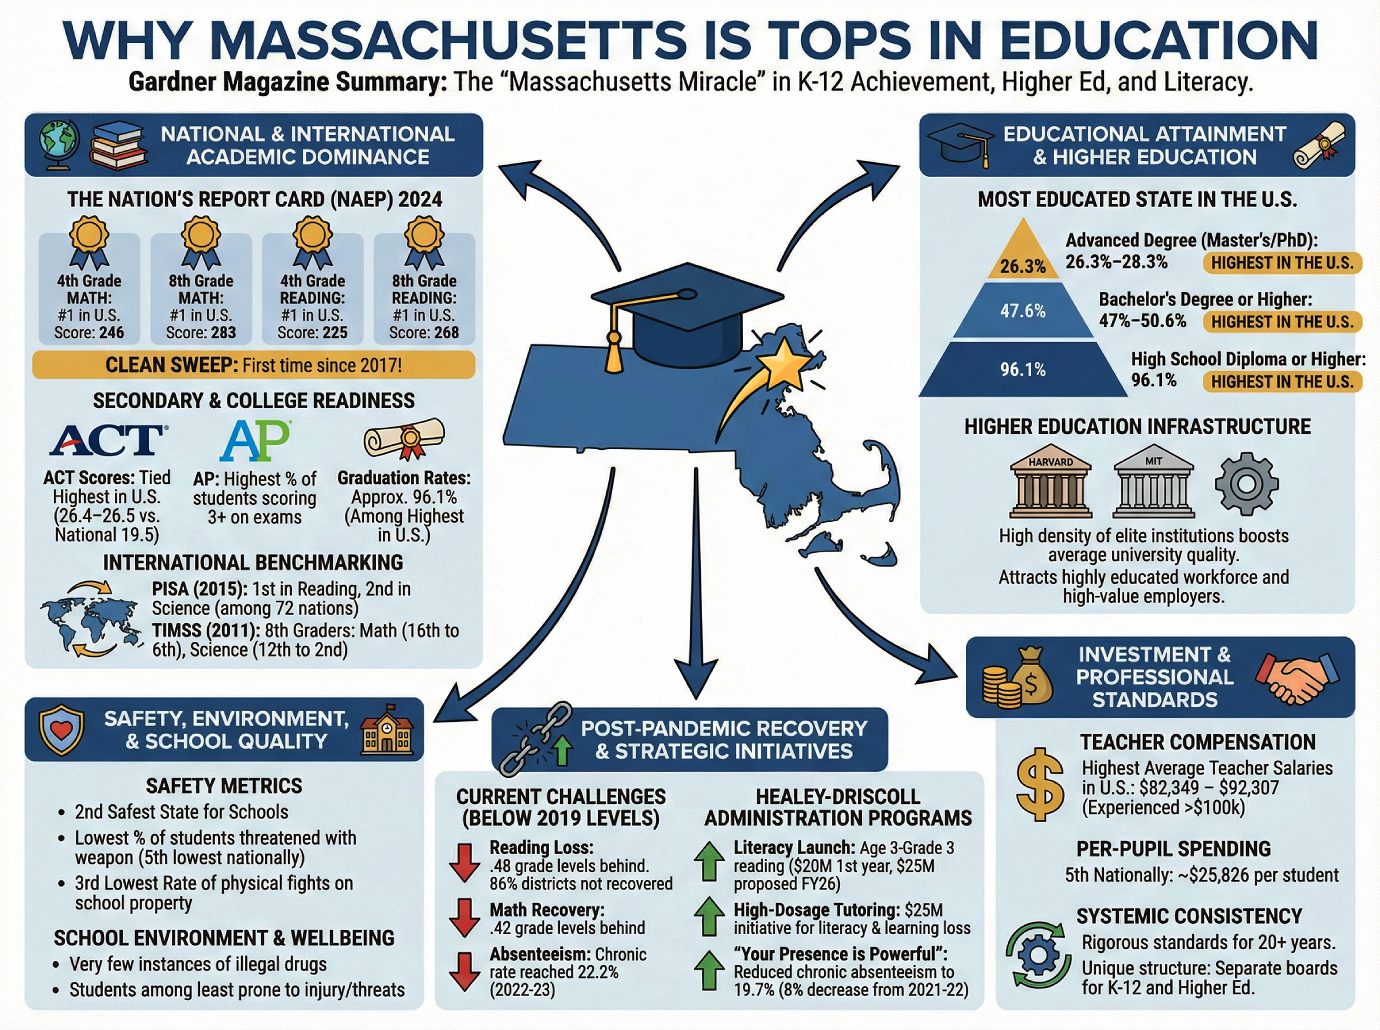
In 2024, Massachusetts ranked first in the nation in all four core NAEP categories. It was the first time the state achieved this clean sweep since 2017.
• Fourth Grade Math: Highest numeric score in the U.S. (246).
• Eighth Grade Math: Highest numeric score in the U.S. (283).
• Fourth Grade Reading: Highest numeric score in the U.S. (225).
• Eighth Grade Reading: Highest numeric score in the U.S. (268).
Secondary and College Readiness
• ACT Scores: Massachusetts is tied for the highest average ACT score in the country at 26.4—26.5, significantly higher than the national average of 19.5.
• Advanced Placement (AP): The state has the highest percentage of students scoring a 3 or better on AP exams.
• Graduation Rates: The high school graduation rate is among the highest in the U.S., estimated at approximately 96.1%.
International Benchmarking
When Massachusetts participates in international assessments as a standalone entity, its results often mirror those of top-tier global performers:
• PISA (2015): The state ranked 1st in the world in reading and 2nd in science among 72 participating nations and entities.
• TIMSS (2011): 8th graders improved from 16th to 6th in the world in math and 12th to 2nd in science between 1999 and 2011.
——————————————————————————–
Educational Attainment and Higher Education
Massachusetts is recognized as the “most educated” state in the U.S. based on the percentage of the population with post-secondary credentials.
| Degree Type | Massachusetts Percentage | National Context |
|---|---|---|
| High School Diploma or Higher | 96.1% | Highest in the U.S. |
| Bachelor’s Degree or Higher | 47% – 50.6% | Highest in the U.S. |
| Advanced Degree (Master’s/PhD) | 26.3% – 28.3% | Highest in the U.S. |
Higher Education Infrastructure
The state’s educational profile is bolstered by a high density of elite institutions, including Harvard and MIT. This environment contributes to Massachusetts having the highest average university quality in the nation. This concentration of higher education attracts a workforce of highly educated graduates, which in turn attracts high-value employers.
——————————————————————————–
Safety, Environment, and School Quality
Beyond academic scores, the quality of the Massachusetts school system is measured by the safety and health of the learning environment.
• Safety Metrics: Massachusetts ranks as the second safest state for schools. It has the lowest percentage of students threatened with a weapon (5th lowest nationally) and the 3rd lowest rate of physical fights on school property.
• School Environment: The state reports very few instances of illegal drugs available on school property compared to national averages.
• Student Wellbeing: Students in Massachusetts are reported to be among the least prone to injury or threats within the school system.
——————————————————————————–
Investment and Professional Standards
The state’s success is frequently attributed to a combination of high funding levels and the professionalization of the teaching workforce.
• Teacher Compensation: Massachusetts offers the highest average teacher salaries in the country, with an average of $82,349 to $92,307. Some salaries for experienced educators exceed $100,000.
• Per-Pupil Spending: The state ranks 5th nationally in per-pupil expenditures, spending approximately $25,826 per student.
• Systemic Consistency: The state has maintained rigorous standards for over two decades. A unique structural feature is the separation of leadership: the Massachusetts Board of Elementary and Secondary Education focuses exclusively on K-12, while a separate board manages higher education.
——————————————————————————–
Post-Pandemic Recovery and Strategic Initiatives
Despite its top rankings, Massachusetts has not been immune to pandemic-related learning loss. Data from the Education Recovery Scorecard indicates that students remain below 2019 levels in both math and reading.
Current Challenges
• Reading Loss: Students are nearly half a grade level (.48) behind 2019 reading levels. As of 2024, 86% of students remain in districts where reading achievement has not recovered to pre-pandemic benchmarks.
• Math Recovery: While students gained over a quarter of a grade level in math between 2022 and 2024, they remain .42 grade levels behind 2019 benchmarks.
• Absenteeism: Chronic absenteeism reached 22.2% in the 2022-23 school year.
State Response: The Healey-Driscoll Administration Programs
The state government has implemented several high-dosage interventions to bridge these gaps:
• Literacy Launch: A multi-year strategy focused on reading success from age 3 through grade 3. The program received $20 million in its first year, with an additional $25 million proposed for FY26 to provide evidence-based materials and professional development.
• High-Dosage Tutoring: A $25 million initiative targeted specifically at literacy growth and addressing pandemic-era learning loss.
• ‘Your Presence is Powerful’ Campaign: A statewide effort to reduce chronic absenteeism, which successfully brought the rate down from 22.2% to 19.7% within one year—an 8 percentage point decrease from 2021-22 levels. ————————————-
Beyond the Zip Code: Decoding the “Massachusetts Miracle” and the Great American Education Divide
Beyond the Zip Code: Decoding the “Massachusetts Miracle” and the Great American Education Divide
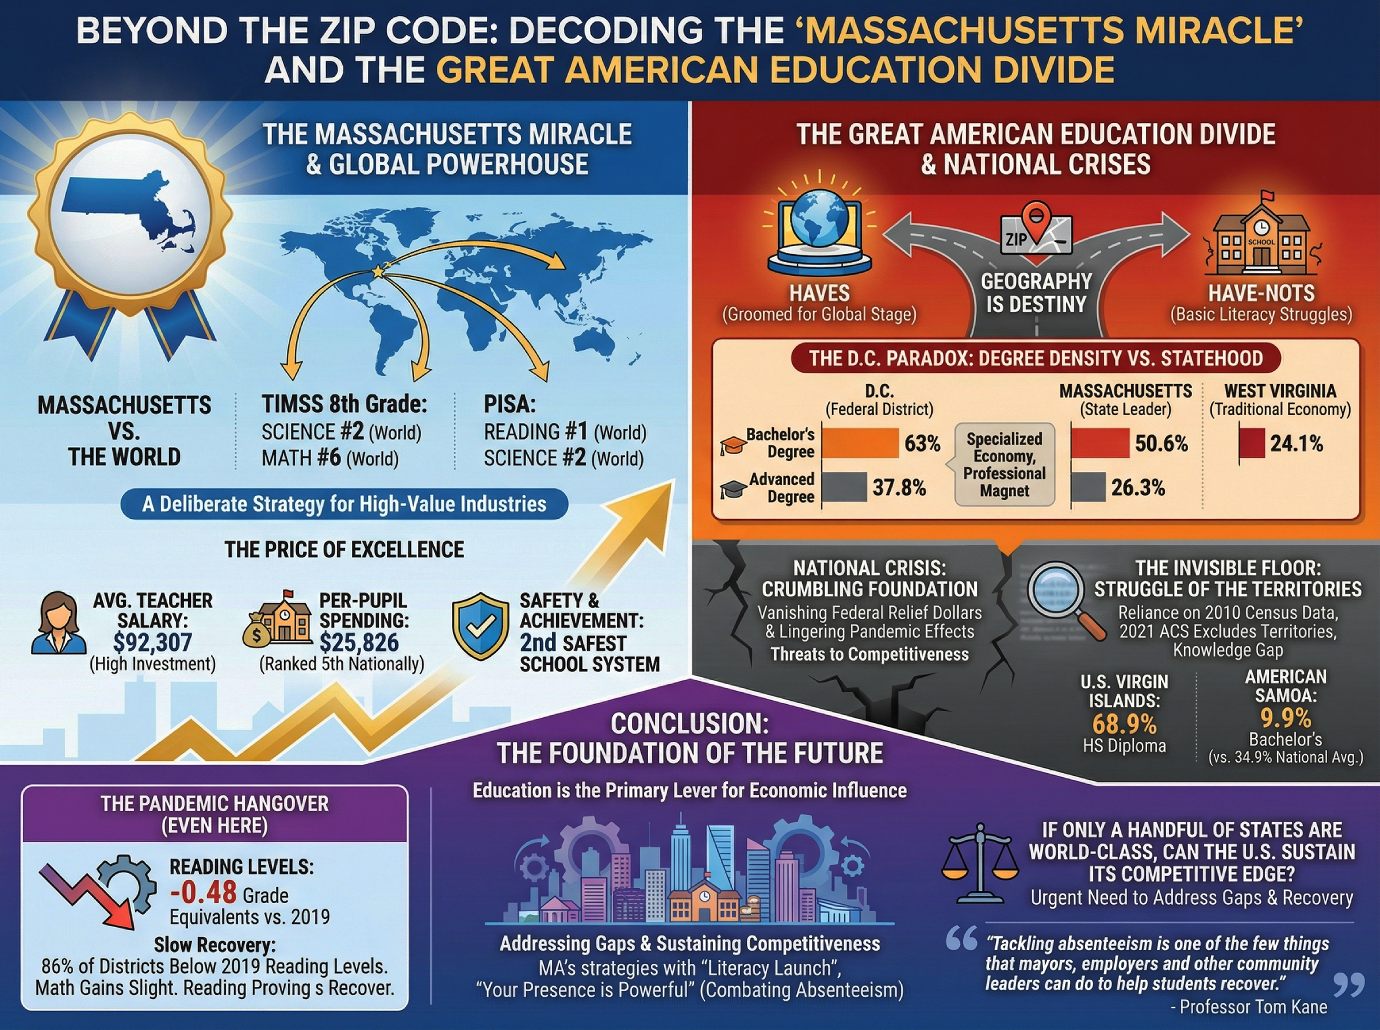
In the modern American economy, geography is destiny. For millions of students, a child’s future is often written in the ink of their zip code, creating a nation of educational “haves” and “have-nots.” While a student in one county may be groomed for the global stage, another just across a state line might attend a school struggling to provide the most basic literacy tools.
The data reveals a starkly bifurcated landscape, but at the summit stands a singular statistical leviathan: Massachusetts. The “Massachusetts Miracle” is not merely a regional success story; it is a robust, decades-long cultivation of excellence that has transformed the Commonwealth into an outlier so significant it recalibrates our understanding of what public education can achieve.
However, this miracle exists in the shadow of a national crisis. As federal relief dollars vanish and the long-tail effects of the pandemic linger, the gap between the highest-performing states and the rest of the country—and particularly the U.S. territories—threatens to undermine American competitiveness. Even at the top, the foundation is showing cracks.
To understand the trajectory of the American workforce, one must look closely at the data defining global powerhouses, the paradox of urban degree density, and the “invisible” floor of the U.S. education system.
The Global Powerhouse: Massachusetts vs. The World
Massachusetts does not merely lead the United States; it competes with the world’s elite nations. When we shift the lens from domestic rankings to international benchmarks, the Commonwealth emerges as a global academic superpower. According to the Trends in International Mathematics and Science Study (TIMSS), Massachusetts 8th graders ranked 2nd in the world for science and 6th for math. The dominance is even more pronounced in the Program for International Student Assessment (PISA) data, where the state ranked 1st in the world for reading and 2nd for science.
This performance shifts the perspective of educational achievement from a parochial competition to a global one. While the U.S. as a whole often languishes in the middle of international tables, Massachusetts occupies the top tier, acting as a massive economic engine for the region. This excellence is a deliberate strategy to anchor the state’s economy in high-value industries.
“Across several years and subjects, the performance of Massachusetts students on international exams confirmed the quality of the Commonwealth’s K-12 public schools. Those high-quality public schools attract workers, and well-educated graduates attract employers.” — Pioneer Institute Study
The D.C. Paradox: Degree Density vs. Statehood
The title of “Most Educated State” belongs to Massachusetts, but the District of Columbia presents a unique statistical anomaly. D.C. possesses a degree density that dwarfs any state in the union: 63% of residents hold a Bachelor’s degree, and an astonishing 37.8% possess advanced degrees (Master’s or Doctorates). For context, Massachusetts—the state-level leader—records 50.6% for Bachelor’s degrees and 26.3% for advanced credentials.
This disparity underscores the difference between a traditional state economy and a specialized federal district. As the seat of the federal government, D.C. acts as a professional magnet for individuals in policy, law, and international administration, sectors that demand high-level academic credentials. In contrast, states like West Virginia (24.1% Bachelor’s rate) maintain traditional economies that do not require—nor currently attract—the same concentration of graduate-level specialized professionals.
The Pandemic Hangover: Even the Best are Falling Behind
Despite its #1 ranking, Massachusetts is currently grappling with a sobering “pandemic hangover.” The Education Recovery Scorecard, a collaboration between Harvard and Stanford, reveals that even the nation’s academic leader is struggling. Massachusetts students are currently nearly half a grade level (.48 grade equivalents) behind their 2019 reading levels.
The recovery is painfully slow: 86% of Massachusetts students are in districts where reading achievement remains below 2019 levels. While math has seen slight gains, the loss in achievement is equivalent to almost 40% of the progress students typically make annually between 4th and 8th grade. While “bright spots” like Lexington (which has surpassed 2019 reading levels), Brookline, Newton, Plymouth, and Brockton are showing resilience, the overall trend suggests that reading is proving much harder to “recover” than math across the board.
The $92,000 Teacher: The Price of Excellence
The “Massachusetts Miracle” is a result of aggressive financial investment in human capital. The state ranks 5th in the nation for per-pupil spending at $25,826. This investment flows directly into the classroom, where the average teacher salary now stands at $92,307.
This financial commitment correlates directly with “Safety and Achievement” outcomes. Massachusetts is ranked as the 2nd safest school system in America, boasting one of the lowest percentages of students threatened with weapons or involved in physical fights on school property. By valuing educators as high-level professionals, the Commonwealth has created an environment that is both academically rigorous and physically secure—proving that excellence has a price tag, and Massachusetts is willing to pay it.
The Geographic Floor: The Struggle of the Territories
The most glaring “human story” in American education data is the one we often cannot see. While we use 2021 American Community Survey (ACS) data for the 50 states, the U.S. territories are excluded from this annual survey. This forces researchers to rely on 2010 Census data, creating a dangerous “knowledge gap” for millions of citizens.
The available data reveals a staggering geographic floor. In the U.S. Virgin Islands, only 68.9% of the population has attained a high school diploma. In American Samoa, Bachelor’s degree attainment stands at just 9.9%, compared to the 34.9% national average. This exclusion from modern data sets leaves these territories “invisible,” making it nearly impossible to address their current educational needs or measure progress against the rest of the nation.
Conclusion: The Foundation of the Future
Education is the primary lever for economic influence, yet the American foundation remains dangerously uneven. While Massachusetts continues to set a world-class standard, the Healey-Driscoll administration has pivoted toward a “Literacy Launch” strategy and the “Your Presence is Powerful” campaign to combat a rise in chronic absenteeism that threatens to stall recovery.
As the expiration of federal pandemic relief dollars forces a new era of fiscal discipline, the pressure to maintain these results is mounting.
“Tackling absenteeism is one of the few things that mayors, employers and other community leaders can do to help students recover.” — Professor Tom Kane, Harvard University
If only a handful of states are performing at a world-class level, can the United States truly sustain its competitive edge? As high-value industries continue to follow the most capable workforces, the question of geographic destiny will only become more urgent. If we do not address the gaps in our territories and the lingering recovery needs of our students, the “miracle” in Massachusetts may remain a singular light in an increasingly dim landscape. ———————————————————-
Regional Benchmarking Analysis: Education as the Catalyst for Economic Resilience and Growth
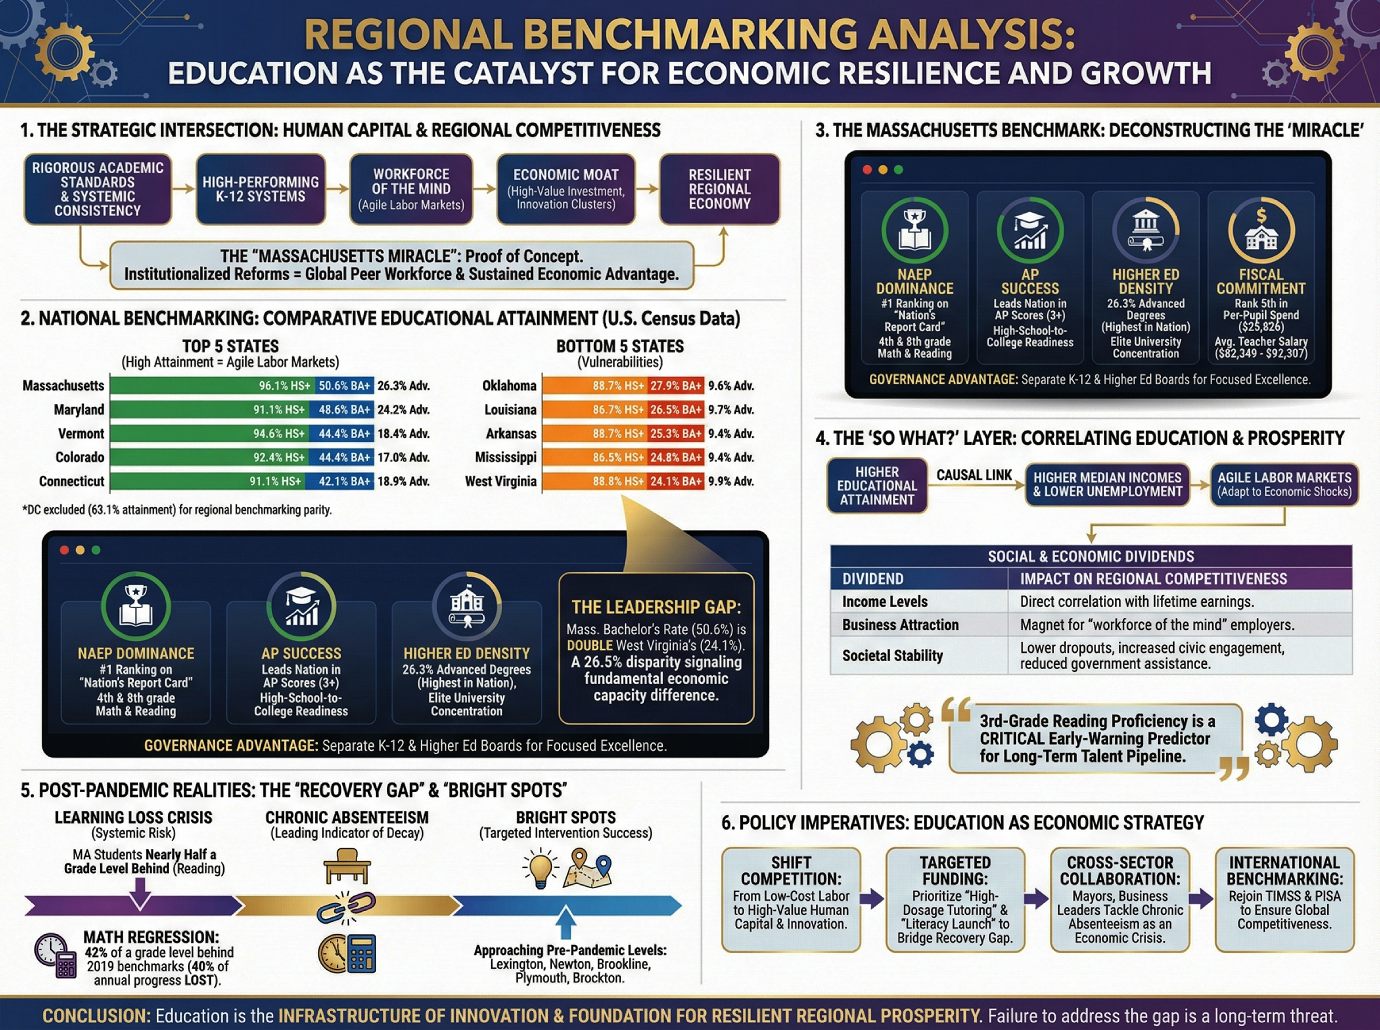
Regional Benchmarking Analysis: Education as the Catalyst for Economic Resilience and Growth
1. The Strategic Intersection of Human Capital and Regional Competitiveness
In the contemporary global economy, educational attainment has transitioned from a social metric to the fundamental infrastructure of modern economic development. For the economic development strategist, human capital is the primary differentiator in the competition for high-value investment and the cultivation of innovation-driven industry clusters. Regions that prioritize rigorous academic standards create a self-sustaining competitive advantage: high-performing K-12 systems produce a “workforce of the mind” that attracts sophisticated, capital-intensive employers, thereby insulating the regional economy from the commoditization of low-cost labor.
The “Massachusetts Miracle” serves as the definitive proof of concept for this strategy. By institutionalizing long-term, high-standard educational reforms and maintaining systemic consistency for decades, Massachusetts has built a workforce that is not merely a domestic leader but a global peer to the world’s most advanced economies. This sustained commitment has effectively created an “economic moat,” providing the state with a resilient talent pipeline that anchors high-value industries. To contextualize this advantage, one must evaluate the empirical data found in national census records, which reveal the widening gap in regional economic capacity.
2. National Benchmarking: A Comparative Analysis of Educational Attainment
Benchmarking state performance against national averages is a critical diagnostic tool for identifying a region’s competitive vulnerabilities and strategic assets. For the education policy strategist, these figures represent the raw material of future economic growth. The significant disparity between the highest and lowest-performing states highlights a diverging national landscape where “agile labor markets” are concentrated in regions with high educational density.
The following table compares the top five and bottom five states based on U.S. Census Bureau data, illustrating the variance in human capital across the country.
| State | % High School Diploma or Higher | % Bachelor’s Degree or Higher | % Advanced Degrees |
|---|---|---|---|
| Top 5 States | |||
| Massachusetts | 96.1% | 50.6% | 26.3% |
| Maryland | 91.1% | 48.6% | 24.2% |
| Vermont | 94.6% | 44.4% | 18.4% |
| Colorado | 92.4% | 44.4% | 17.0% |
| Connecticut | 91.1% | 42.1% | 18.9% |
| Bottom 5 States | |||
| Oklahoma | 88.7% | 27.9% | 9.6% |
| Louisiana | 86.7% | 26.5% | 9.7% |
| Arkansas | 88.7% | 25.3% | 9.4% |
| Mississippi | 86.5% | 24.8% | 9.4% |
| West Virginia | 88.8% | 24.1% | 9.9% |
Note: The District of Columbia was excluded from this state-to-state comparison despite its 63.1% attainment rate to maintain regional benchmarking parity.
The data reveals a stark leadership gap: Massachusetts reports a Bachelor’s degree attainment rate of 50.6%, more than double that of West Virginia (24.1%). This 26.5 percentage point disparity represents more than just a graduation gap; it signifies a fundamental difference in a region’s ability to host high-value research, life sciences, and professional service sectors. Massachusetts’ dominance is not an accident of geography but the result of a deliberate structural model.
3. The Massachusetts Benchmark: Deconstructing the “Miracle”
Massachusetts serves as the “Gold Standard” for regional benchmarking because it has successfully converted educational rigor into a resilient economic moat. By maintaining consistent investment and refusing to compromise on assessment standards, the Commonwealth has achieved a level of human capital density that rivals sovereign nations.
The following Key Performance Indicators (KPIs) define the Massachusetts model:
• National Assessment (NAEP) Dominance: Massachusetts consistently secures the #1 ranking on the “Nation’s Report Card,” receiving the highest numeric scores in the country for 4th and 8th-grade math and reading.
• Advanced Placement (AP) Success: The Commonwealth leads the nation in the share of students scoring a 3 or better on AP exams, a vital indicator of high-school-to-college transition readiness.
• Higher Education Density: Leveraging a high concentration of elite universities, 26.3% of the adult population holds advanced degrees (Master’s or Doctorates), the highest density in the nation.
• Financial Commitment: Strategic excellence is supported by aggressive fiscal policy. The state ranks 5th in the nation in per-pupil expenditure ($25,826) and maintains an average teacher salary between 82,349and∗∗92,307** (representing the average at the top end of the scale).
Structurally, Massachusetts maintains a distinct governance advantage by utilizing separate, specialized boards for K-12 and Higher Education. This institutional specialization allows the Board of Elementary and Secondary Education to focus exclusively on foundational excellence without the distractions of university-level administration. This clarity of mission ensures that academic success is consistently translated into tangible economic outcomes.
4. The “So What?” Layer: Correlating Education with Economic Prosperity
The link between educational benchmarks and state-wide economic vitality is causal and direct. Higher educational attainment is the single most reliable predictor of higher median incomes and lower unemployment. In the lexicon of economic development, a highly educated workforce creates “agile labor markets”—populations that do not merely withstand economic shocks but actively adapt to them.
As noted by experts such as Dr. Mark Fincher and Luis S. Toledo, educated workforces possess the cognitive flexibility to pivot into new industry opportunities created by economic disruption. Furthermore, Toledo highlights that 3rd-grade reading proficiency is a critical early-warning predictor for high school graduation; failing this benchmark creates a long-term drag on the regional talent pipeline.
Social and Economic Dividends of High Attainment
| Dividend | Impact on Regional Competitiveness |
|---|---|
| Income Levels | Direct correlation between degrees and compensation; attainment is the primary predictor of lifetime earnings. |
| Business Attraction | Concentrated pools of advanced degree holders act as a magnet for “workforce of the mind” employers in high-value manufacturing and tech. |
| Societal Stability | High performance correlates with lower dropout rates, increased civic engagement, and a significantly reduced reliance on government assistance. |
These economic dividends, however, are currently under threat as post-pandemic data reveals a significant regression in foundational learning.
5. Post-Pandemic Realities and the “Recovery Gap”
Learning loss represents a systemic risk to the future workforce pipeline, creating a “domino effect” that compromises long-term regional competitiveness. According to the “Education Recovery Scorecard,” the impact in Massachusetts is acute: students remain nearly half a grade level (.48 grade equivalents) behind 2019 reading levels.
The most alarming metric is found in mathematics. While there have been minor gains since 2022, students remain 42% of a grade level behind 2019 benchmarks. To a policy strategist, this represents a crisis of velocity: the loss in math achievement in Massachusetts is nearly 40 percent of the progress students typically make annually. Compounding this is the threat of chronic absenteeism. Professor Tom Kane of Harvard emphasizes that tackling absenteeism is a critical priority for mayors and employers, as it is a leading indicator of workforce pipeline decay.
Bright Spots in the Recovery Success is possible through targeted intervention. Districts such as Lexington, Newton, Brookline, and Plymouth are approaching pre-pandemic levels. Notably, Brockton has also emerged as a vital proof of concept, approaching 2019 levels in math despite different demographic profiles than its peers. These “bright spots” provide the roadmap for the following final policy imperatives.
6. Policy Imperatives: Integrating Education into Economic Strategy
To maintain a sustainable and resilient regional economy, leaders must view education policy as a core component of economic development. We must shift from a mindset of social spending to one of human capital investment.
1. Shift from Low-Cost to High-Value Competition: States cannot win a “race to the bottom” based on low-cost labor. Strategy must focus on cultivating high-value human capital to attract resilient industry clusters.
2. Targeted Intervention Funding: Federal and state dollars (including Title I funds) should be prioritized for “high-dosage tutoring” and “literacy launch” programs to bridge the recovery gap before it permanently degrades the labor pool.
3. Cross-Sector Collaboration: Chronic absenteeism must be treated as an economic crisis. Mayors, business leaders, and community organizers must collaborate to ensure classroom attendance is prioritized as a workforce prerequisite.
4. International Benchmarking: Massachusetts must rejoin international assessments like TIMSS and PISA. Historically, the Commonwealth’s students have ranked on par with the highest-performing countries—for example, ranking 2nd in the world in science in 2011. Rejoining these assessments is essential to ensure the workforce remains globally competitive.
Education is the absolute foundation of a sustainable, resilient regional economy. It is the infrastructure of innovation, the primary tool for social mobility, and the most potent economic policy available to state leaders. Failure to address the current recovery gap is not merely an educational oversight; it is a long-term threat to our regional prosperity. —————————