Greater Gardner MA Winter Weather Outlook 2021-2022
Jump to: Meteoblue January, February, March 2022 — NOAA Winter Outlook — History of Temperature and Precipitation – Climate Change Gardner MA —- Mean Total Precipitation Gardner MA 1979 to 2022 —- Gardner Temperatures by Month 1979 to 2022
from Meteoblue:
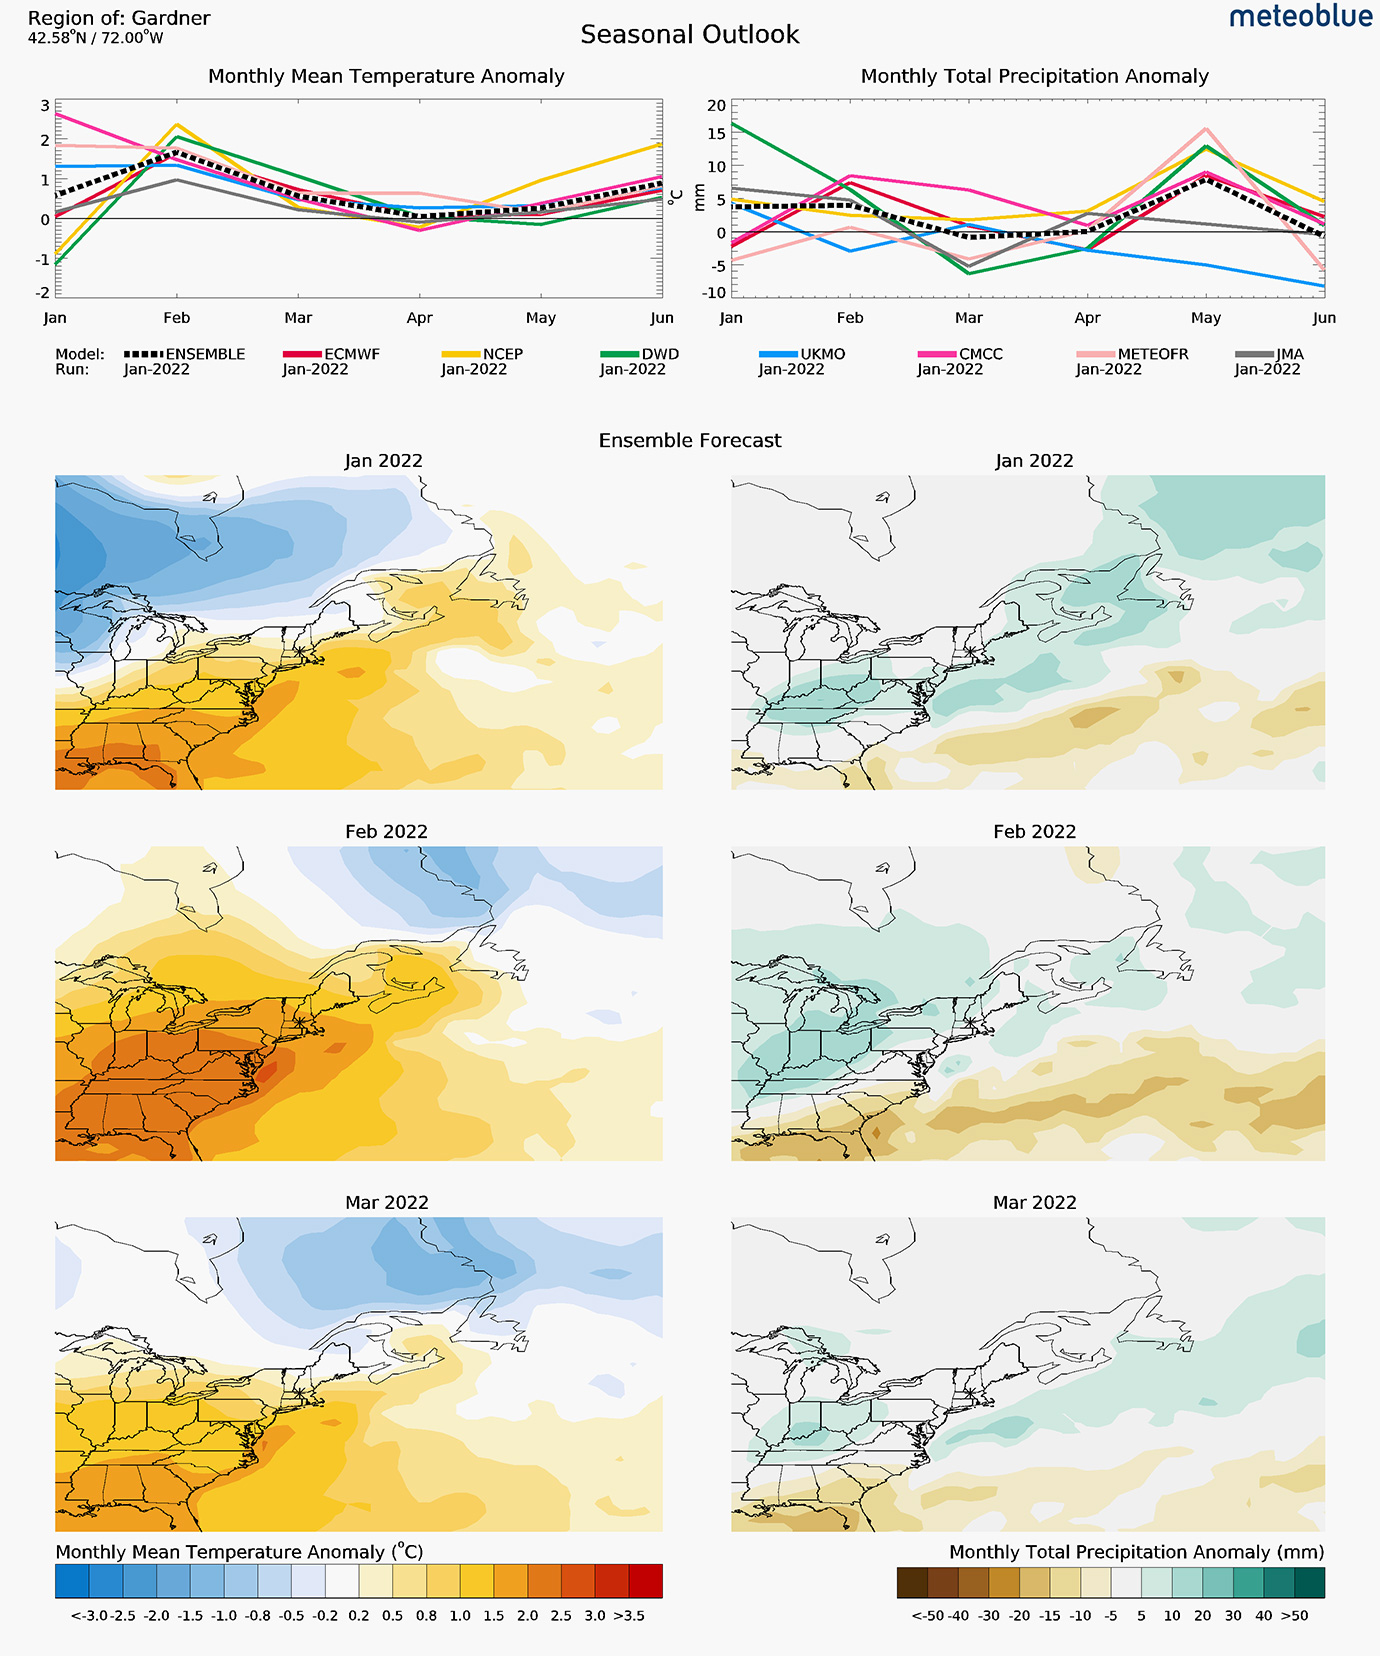
Overview of chart below:
The seasonal climate forecast for the region of Gardner shows the monthly mean temperature and precipitation anomalies for the next 6 months in the top panel. The forecast is regional for areas of 100 km by 100 km or larger. Then temperature and precipitation is shown for January, February, and March 2022
The seasonal forecast provides climate characteristics such as mean values or anomalies for an entire month. Anomalies are deviations from the climatological mean. Thus, a negative temperature and precipitation anomaly indicates cooler and drier than average conditions. Climatological information allow little inference on the expected weather. Assume a month with a positive anomaly of +1 degree. It is very unlikely that every hour of this month is 1 degree warmer. A more realistic scenario is that some days are significantly warmer than average, while others are on average. Most importantly, there might also be some days that are colder or even significantly colder than average, so the positive anomaly is not at all a guarantee to have e.g. no frost.
A seasonal weather forecast for particular day is not technically possible: it is statistically more unreliable than a climatic average. The reason is that daily weather is subject to larger swings influenced by mesoscale or microscale events, and originating factors cannot be measured precisely enough, so daily weather forecasts become statistically more unreliable than a climatic average about 10-14 days ahead. You probably noticed the unreliability of a 10-day weather forecast and predicting several months is clearly more difficult.
Hundreds of Forecasts Combined
As seasonal forecasts can be more or less reliable, we provide the results of several hundred forecasts to better estimate a trend. We combine all the seasonal forecasts computed by the major Centers and Institutions worldwide into a Super-Ensemble (ENSEMBLE) that is more likely to be correct than a forecast from a single Institution. If you see that forecasts of different models contradict each other, then there is very little hope of forecasting the season for that time period. There are some regions and situations where seasonal forecasts can be quite accurate. The most well-known examples are El Niño and La Niña situations.
Various Models Presented
The different models presented here are computed by: the European Center of Medium Range Weather Forecast (ECMWF), the National Center of Environmental Prediction (NCEP/NOAA), the German Weather Service (DWD), the UK-MetOffice (UKMO), MeteoFrance (METEOFR), the Japan Meteorological Agency (JMA) and the Euro-Mediterranean Center on Climate Change (CMCC). The Agencies/Centers update their forecasts about once per month, but not all do so at the same time. We therefore indicate the forecast-run of each center in the diagram. We recompute the ensemble whenever one of the centers updates a forecast.
.
NOAA Winter Outlook
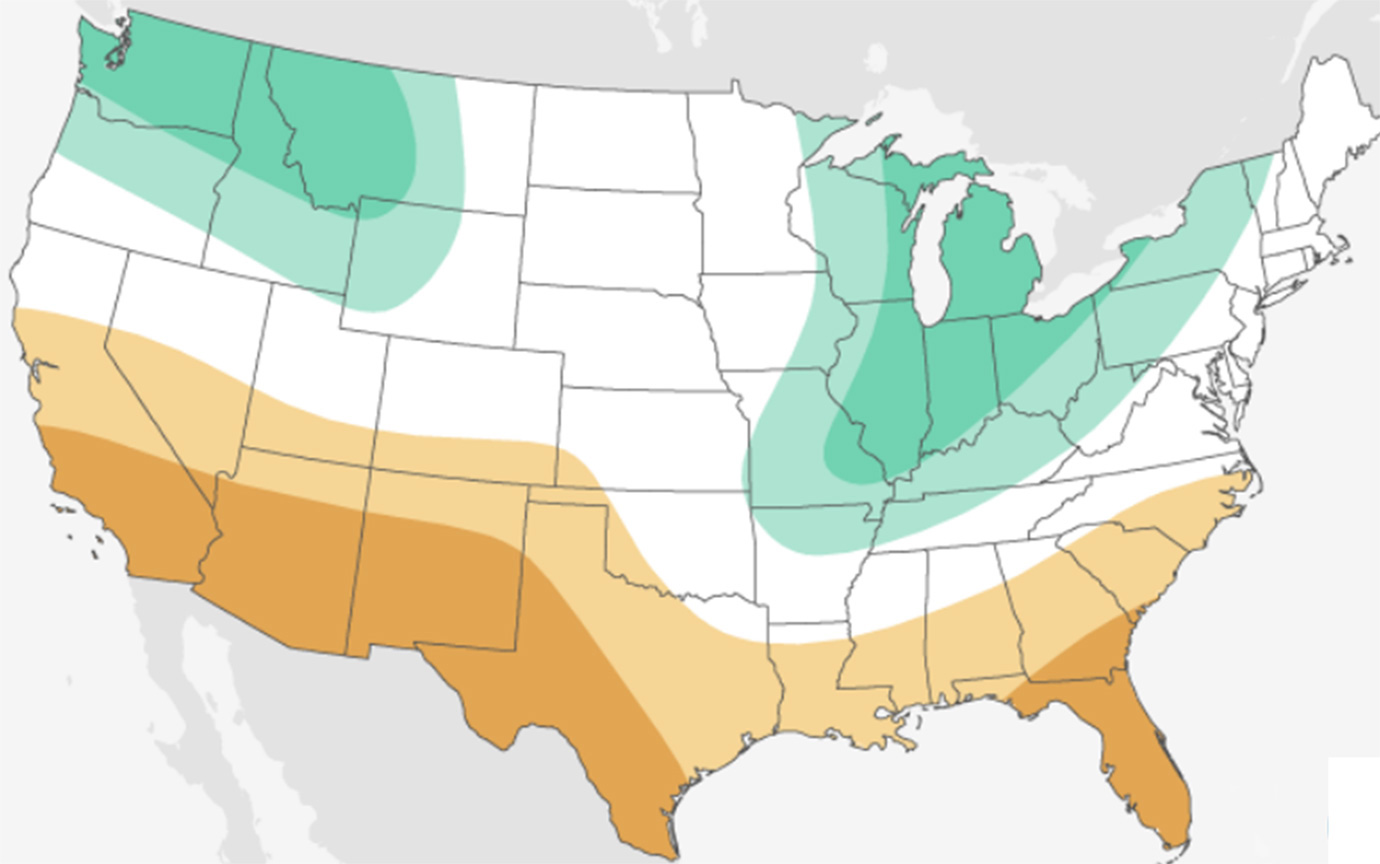
NOAA Winter Outlook 2021
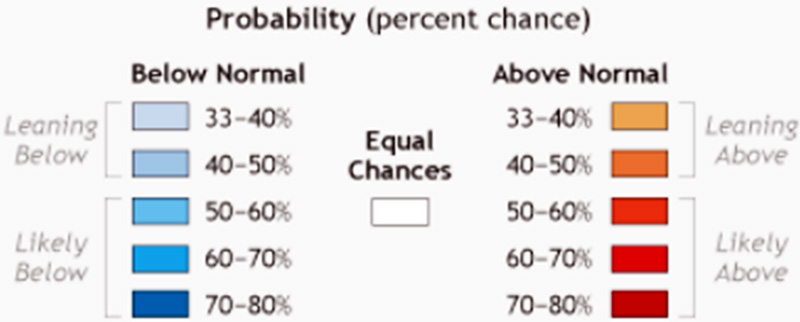
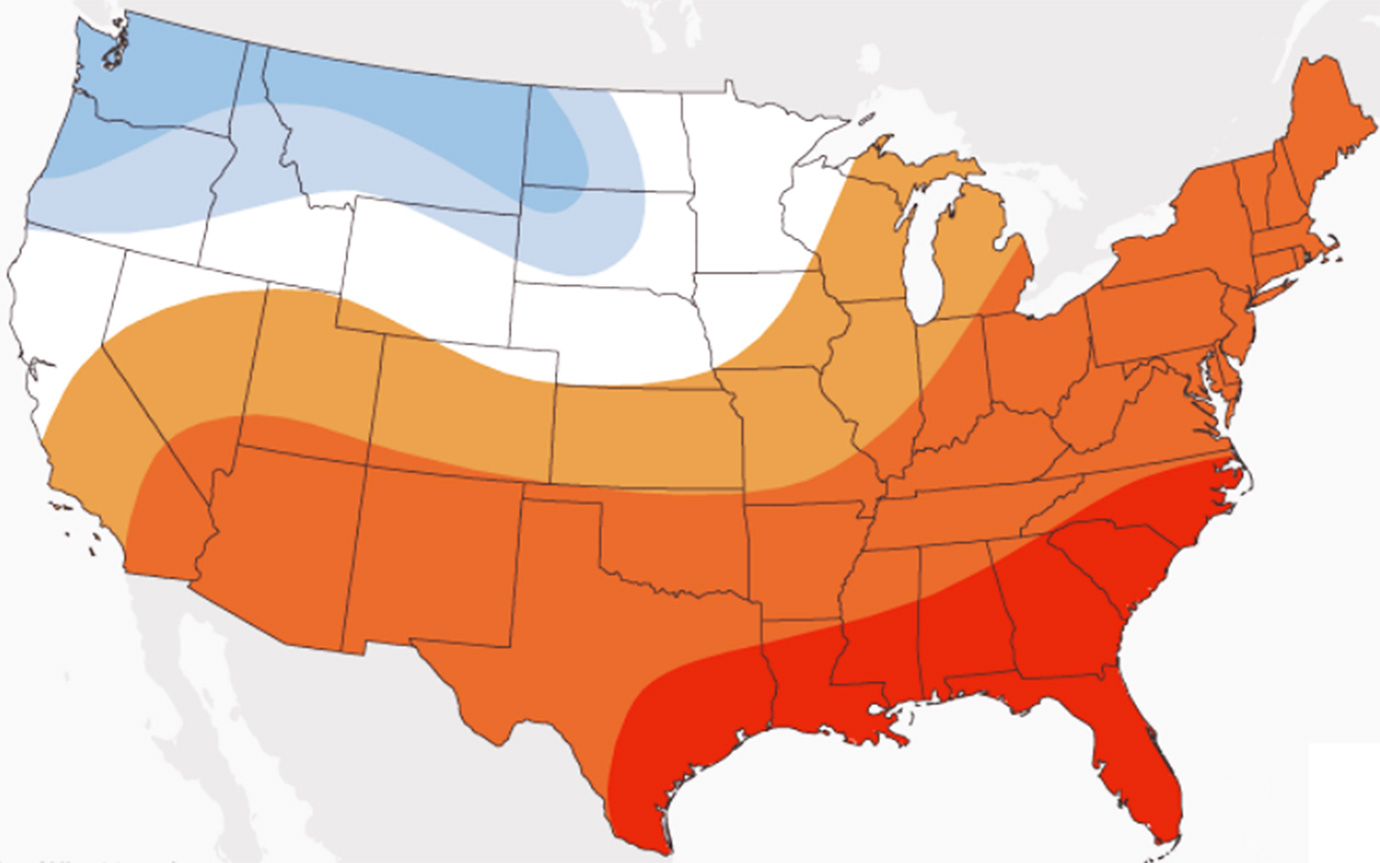
According to NOAA, the Greater Gardner MA temperatures for the 2021/2022 winter season have a 40 to 50% chance of being above normal. Jump to Media Briefing Weather Video — Visit our comprehensive Greater Gardner Weather Center.
Winter Precipitation Forecast
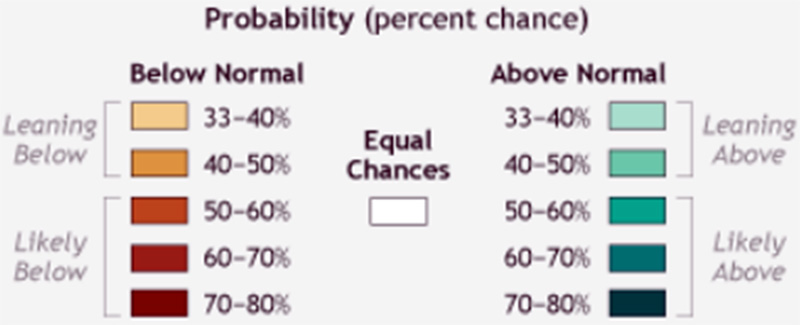
According to NOAA, the Greater Gardner MA precipitation forecast is for equal chance that the amount of snow will be below normal or above normal.
Watch the National Weather Service Winter Outlook 2021 Media Briefing
History – Temperature and Precipitation Gardner MA – 1979 to 2022
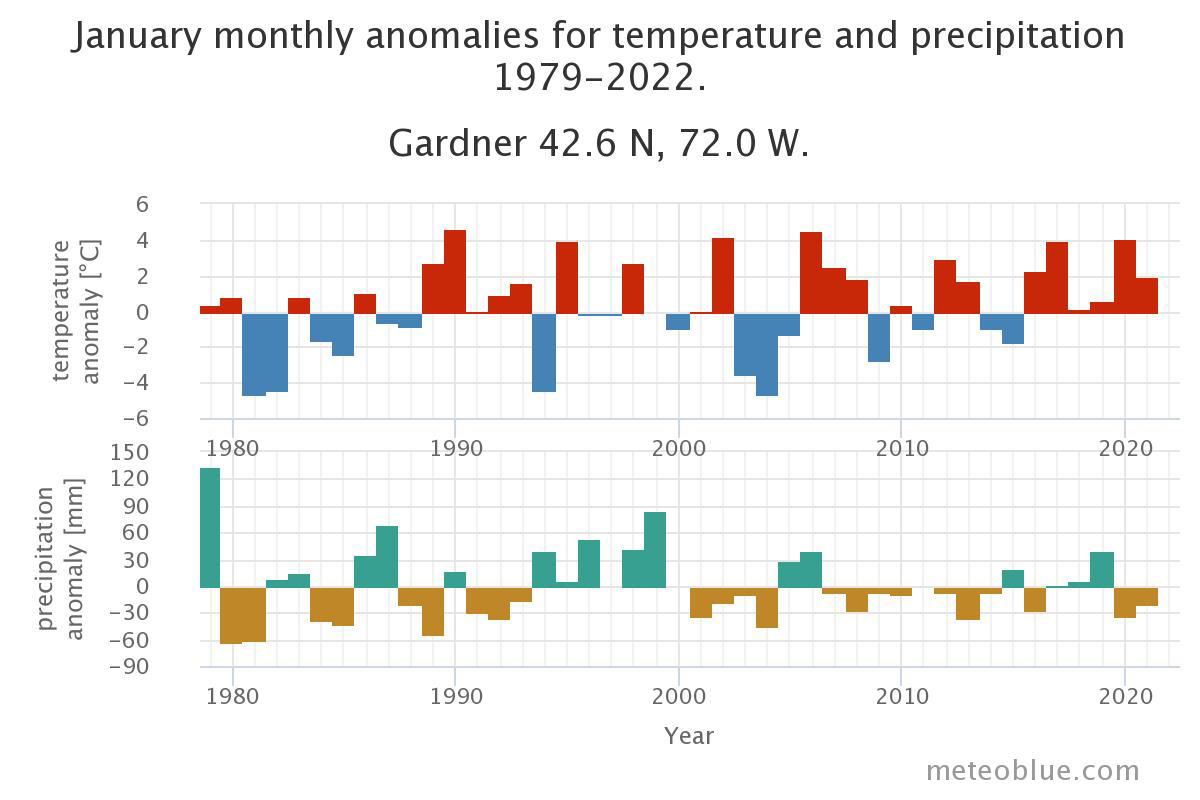
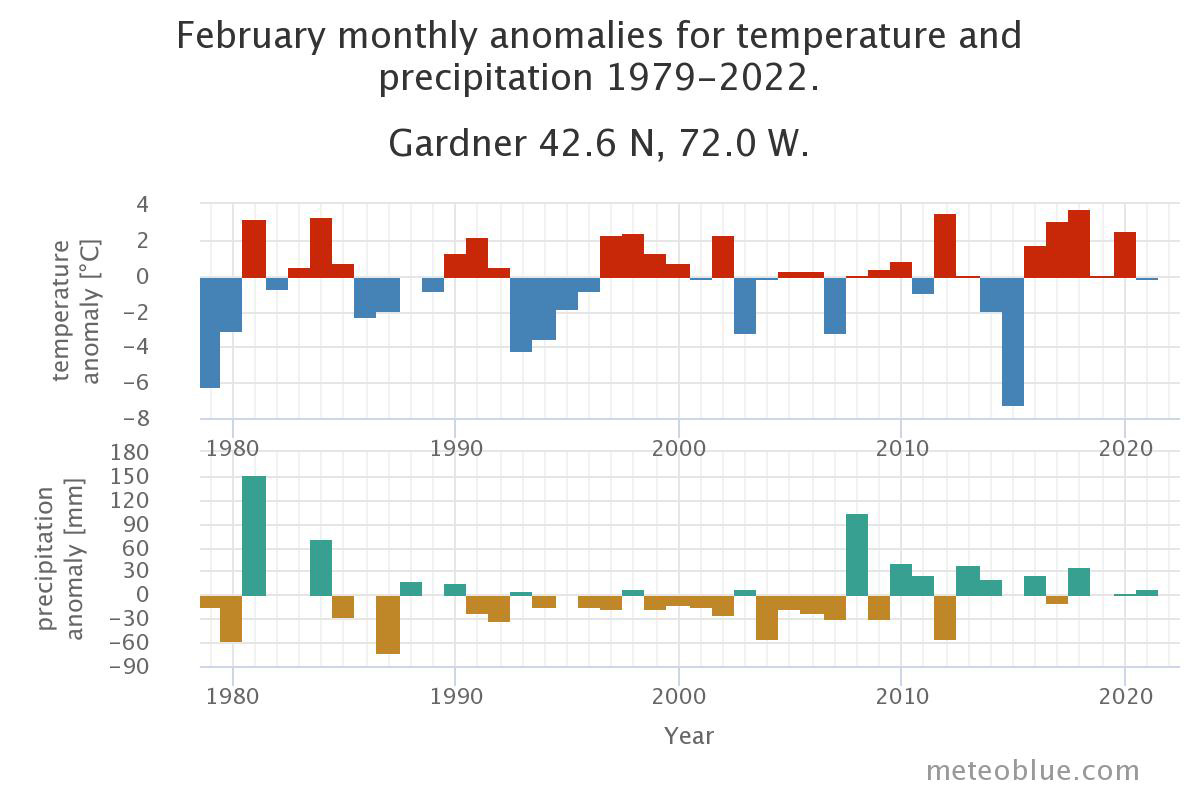
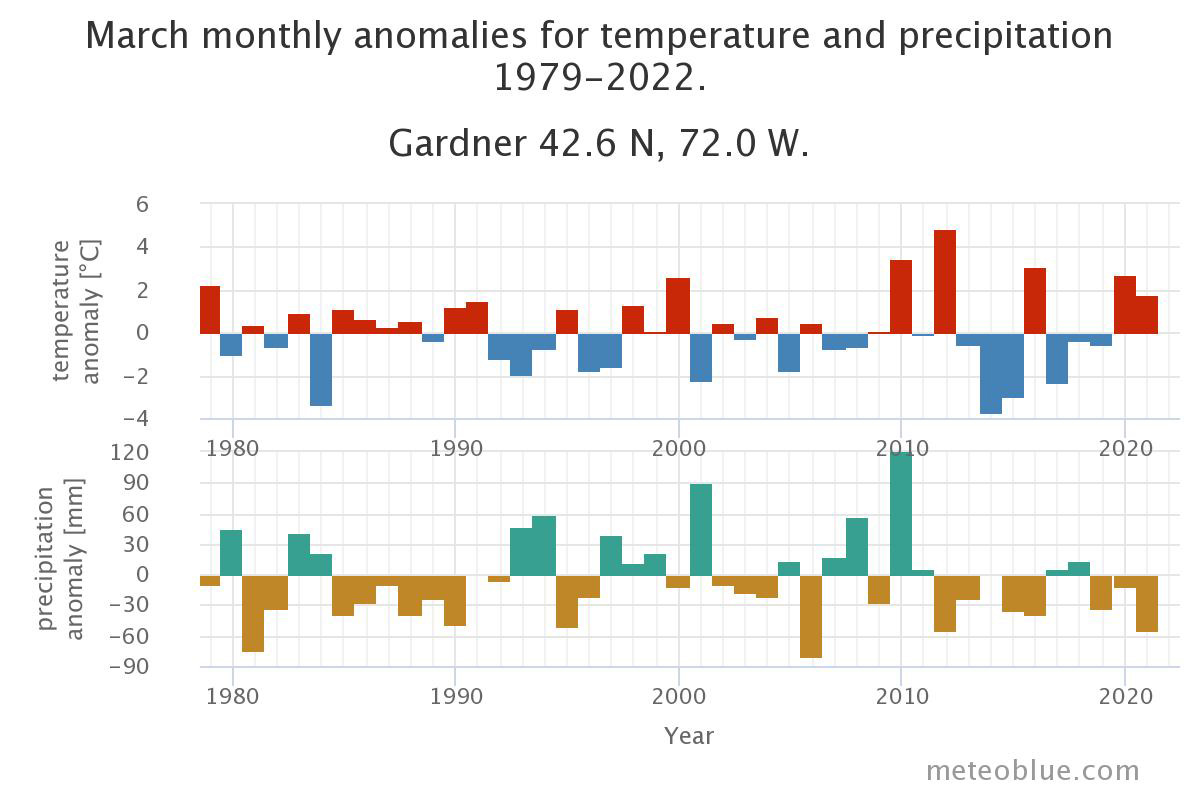
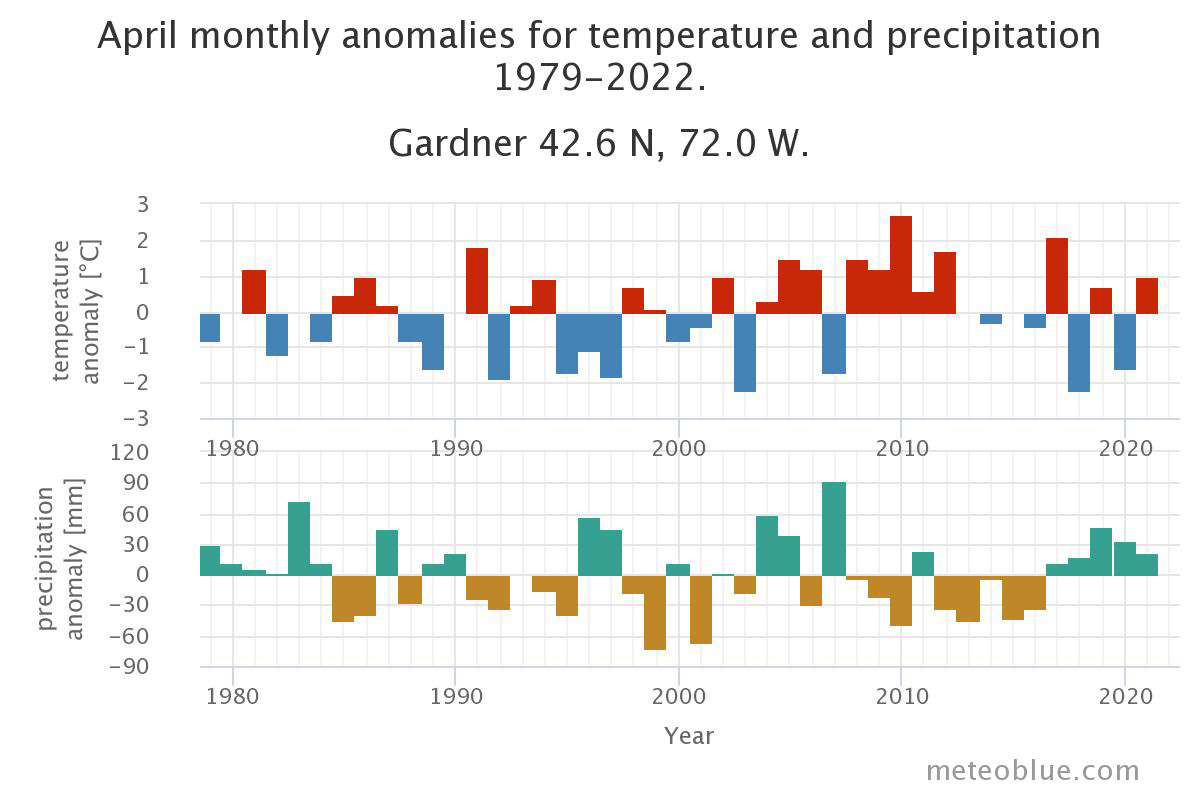
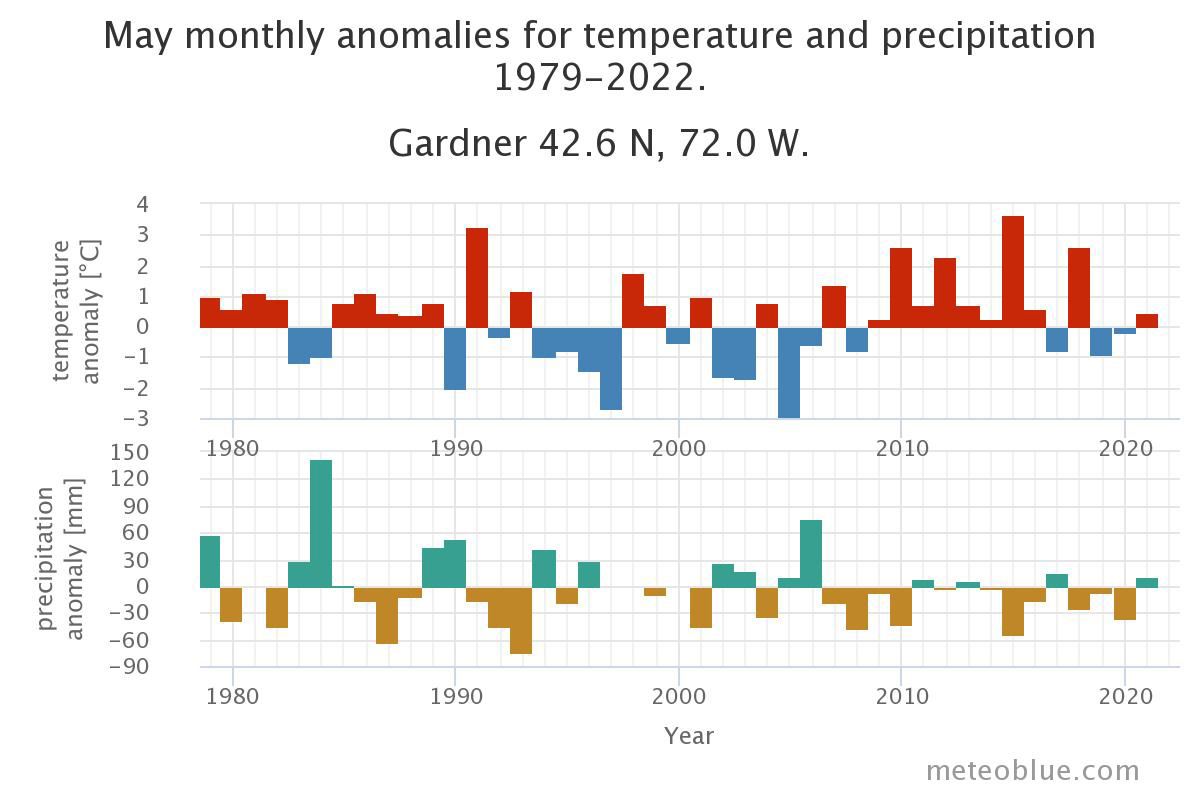
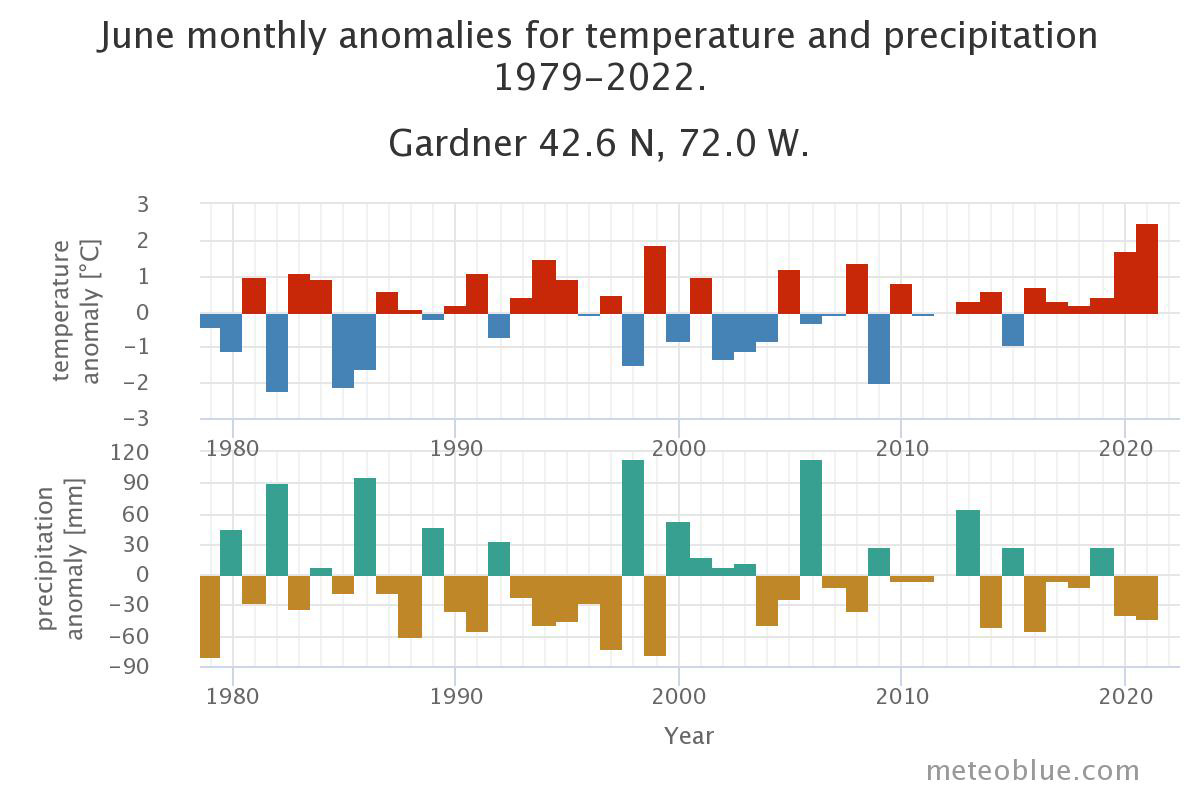
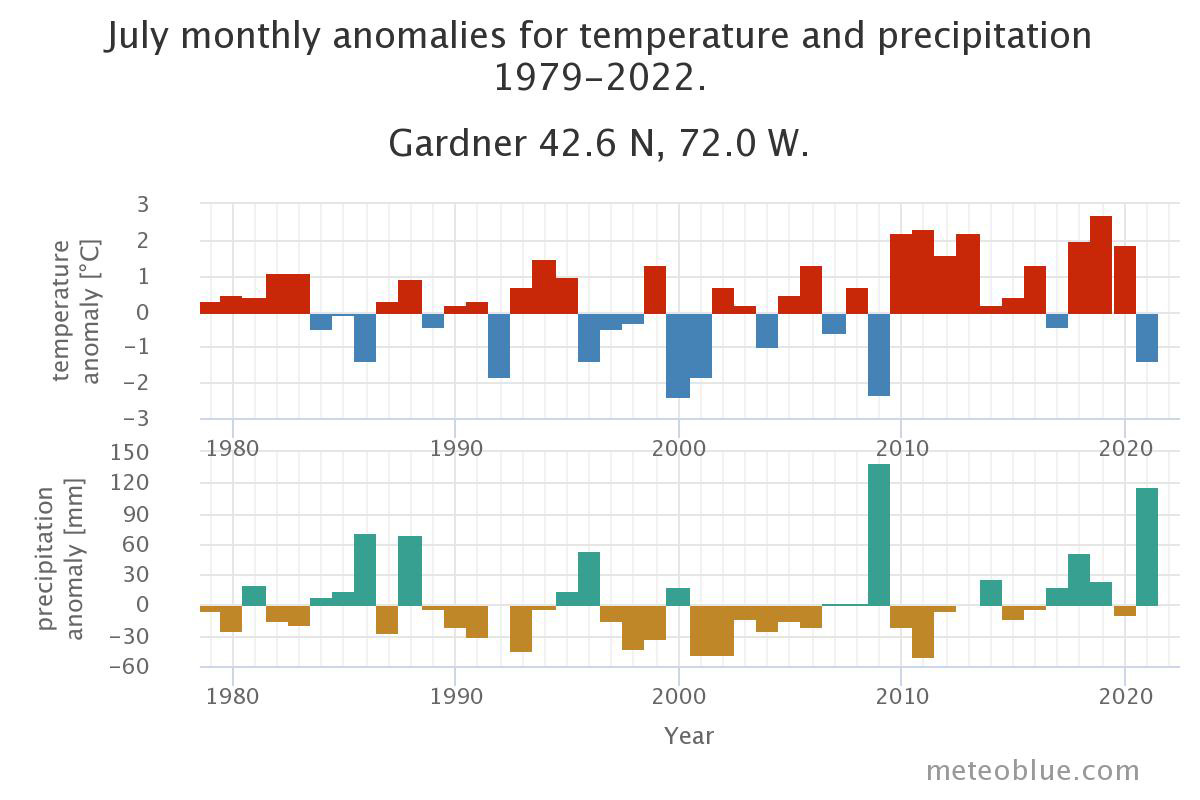
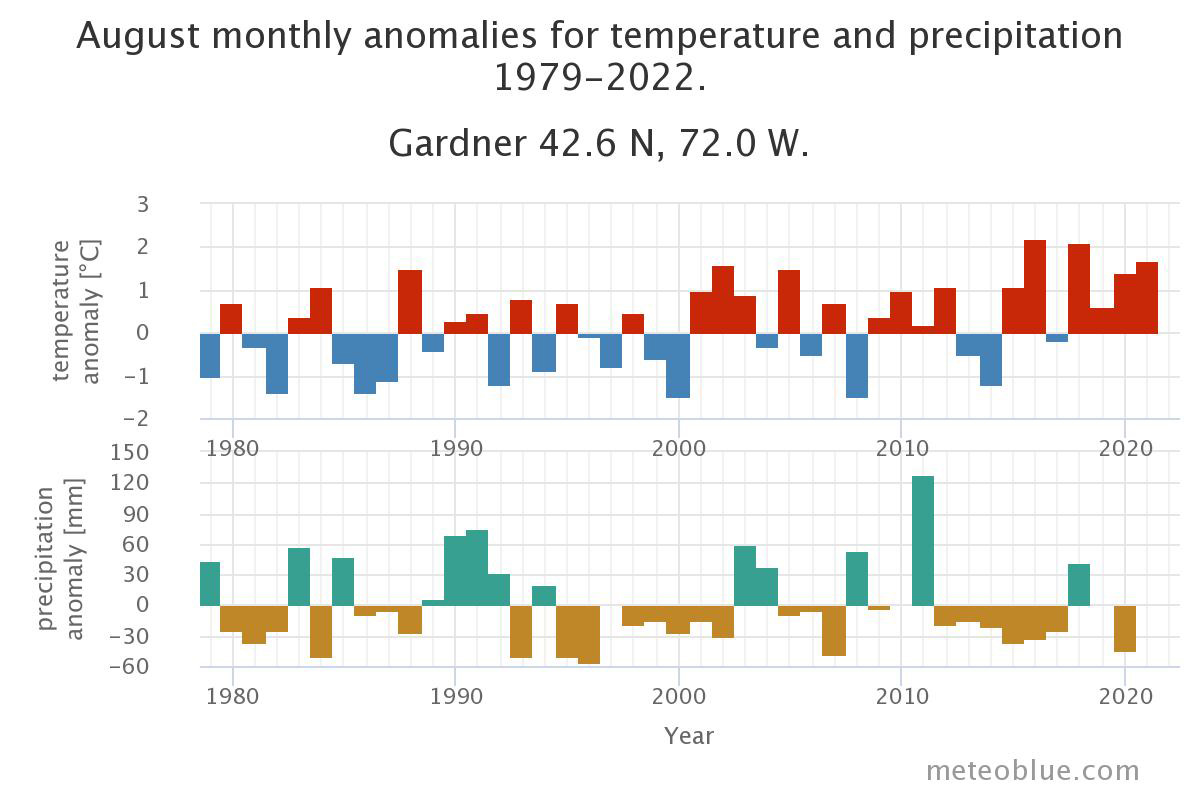
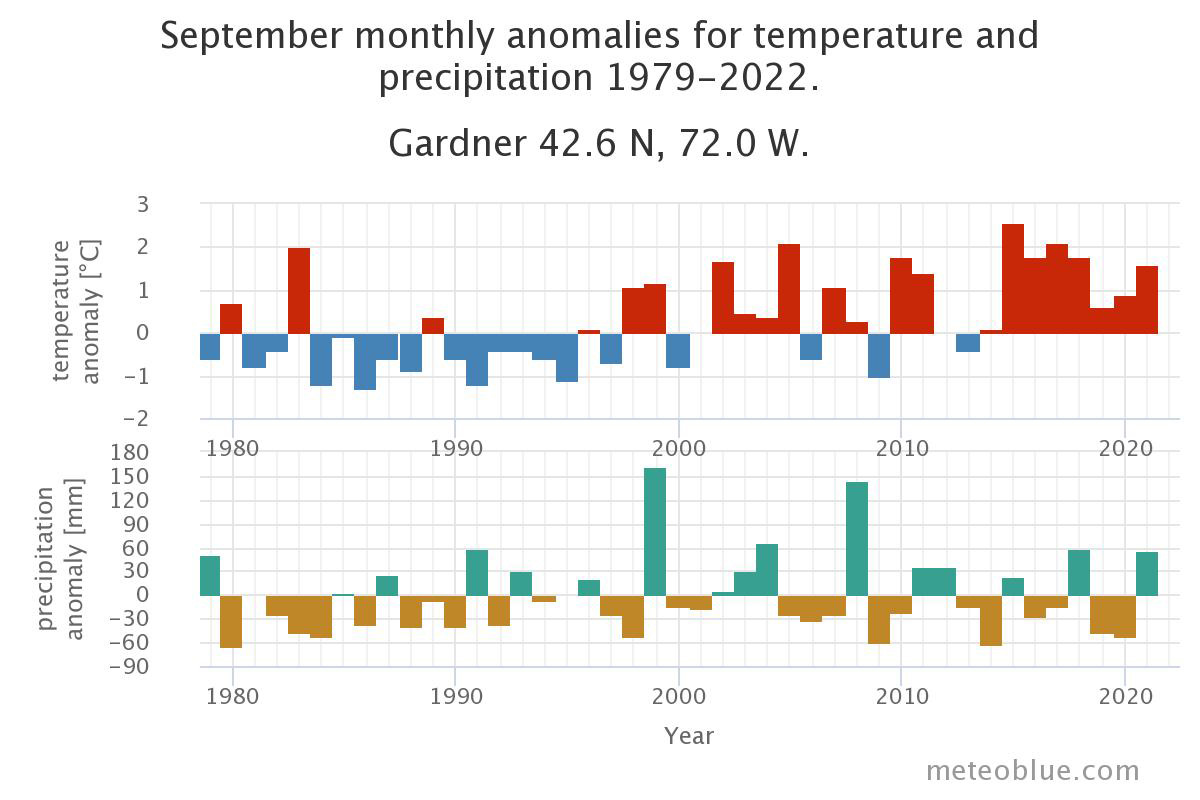
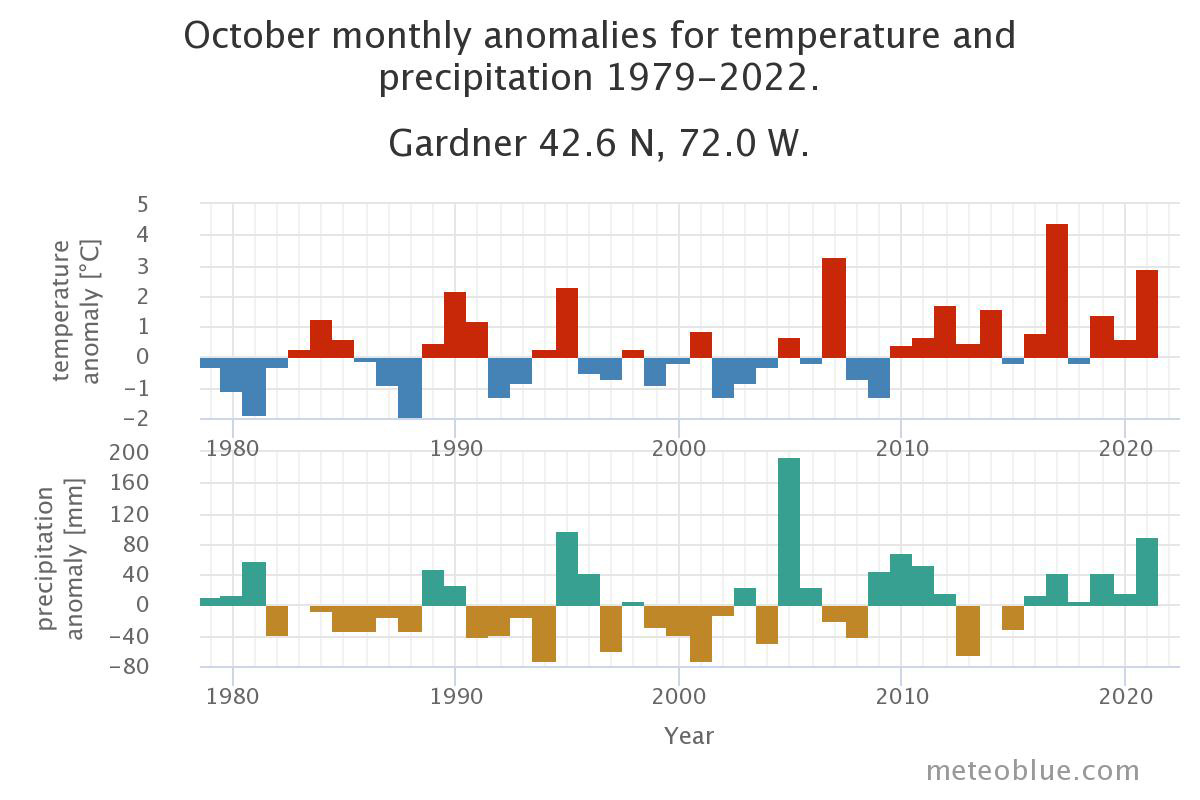
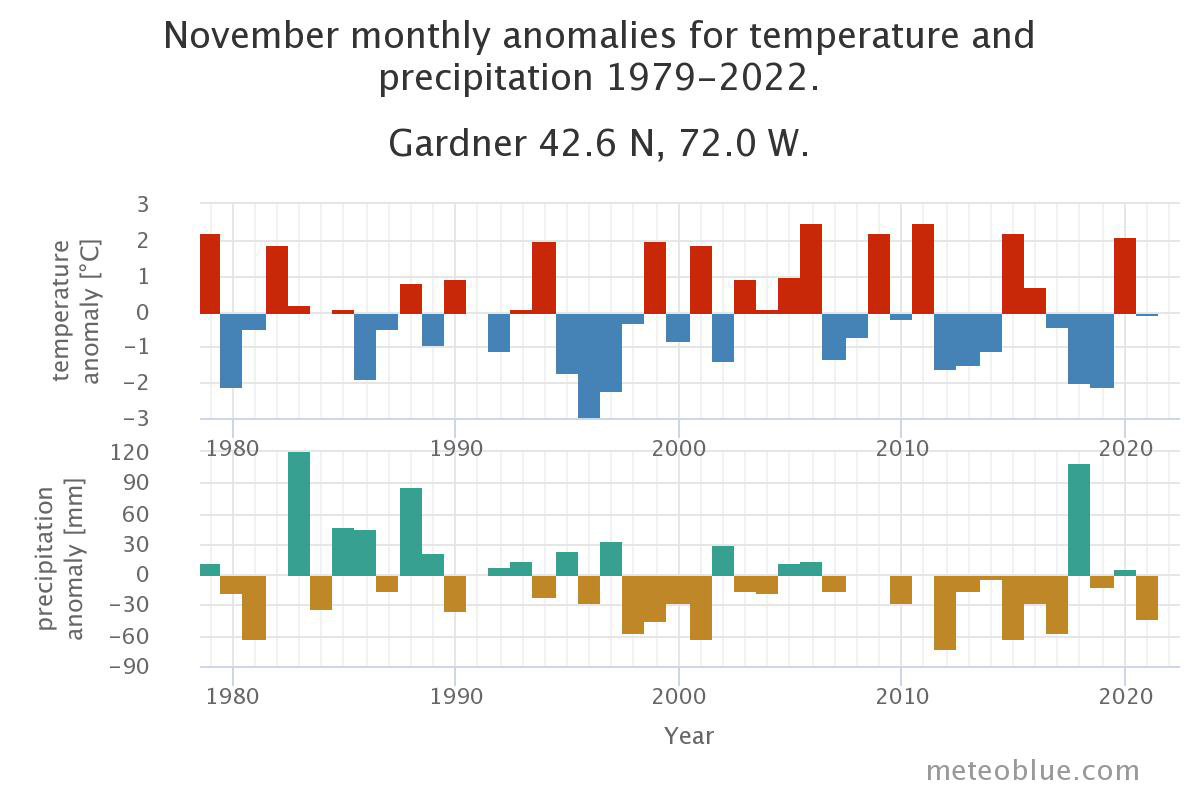
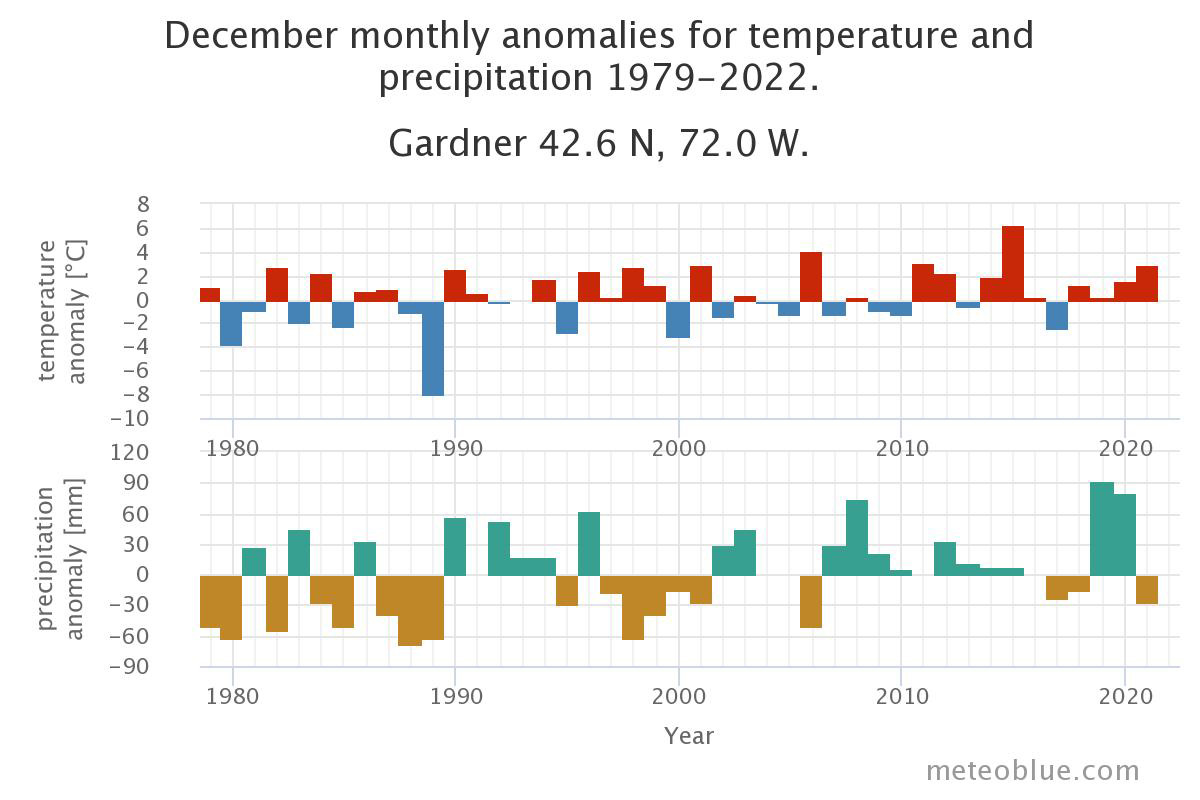
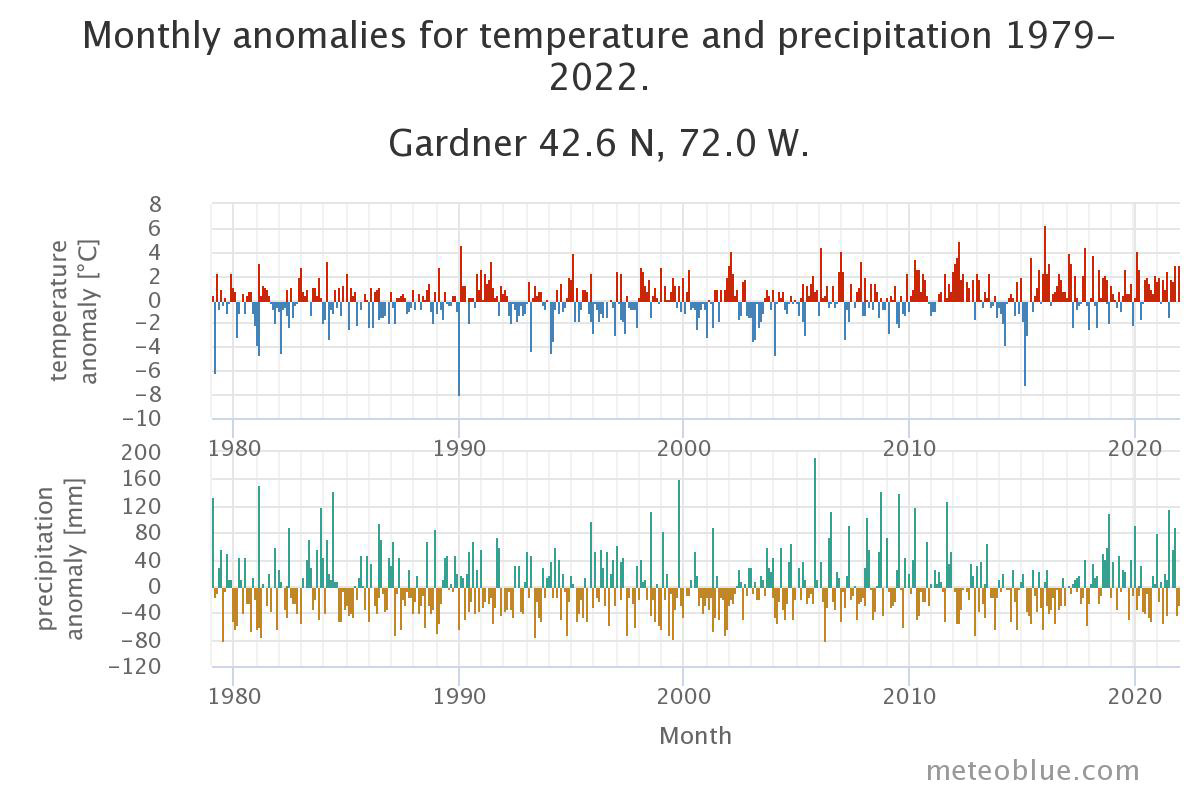
The top graph shows the temperature anomaly for every month since 1979 up to now. The anomaly tells you by how much it was warmer or colder than the 30 year climate mean of 1980-2010. Thus, red months were warmer and blue months were colder than normal. In most locations, you will find an increase of warmer months over the years, which reflects the global warming associated with climate change.
The lower graph shows the precipitation anomaly for every month since 1979 up to now. The anomaly tells you if a month had more or less precipitation than the 30 year climate mean of 1980-2010. Thus, green months were wetter and brown months were drier than normal.
Mean Total Precipitation Gardner MA 1979 to 2022
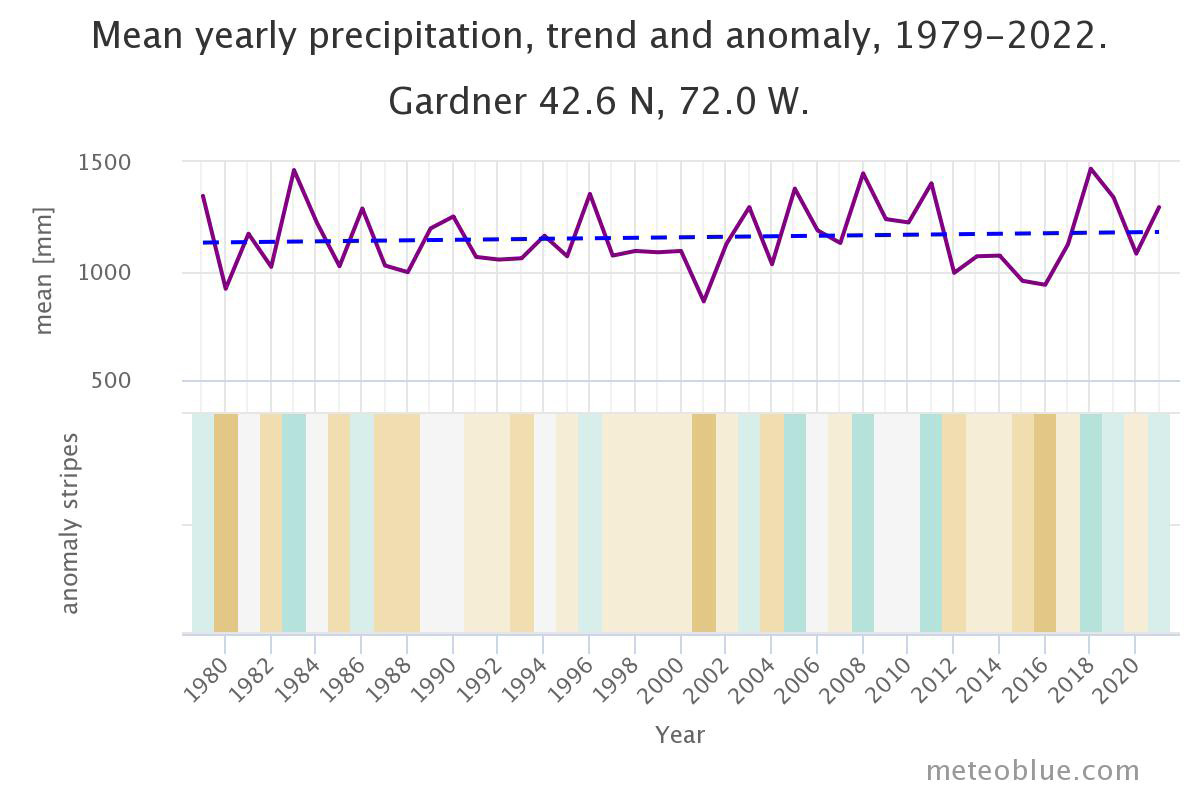
The top graph shows an estimate of mean total precipitation for the larger region of Gardner. The dashed blue line is the linear climate change trend. If the trend line is going up from left to right, the precipitation trend is positive and it is getting wetter in Gardner due to climate change. If it is horizontal, no clear trend is seen and if it is going down conditions are becoming drier in Gardner over time.
In the lower part the graph shows the so called precipitation stripes. Each colored stripe represents the total precipitation of a year – green for wetter and brown for drier years.
Gardner MA Temperatures by Month 1979 to 2022
Click on any graphic to bring up larger size

