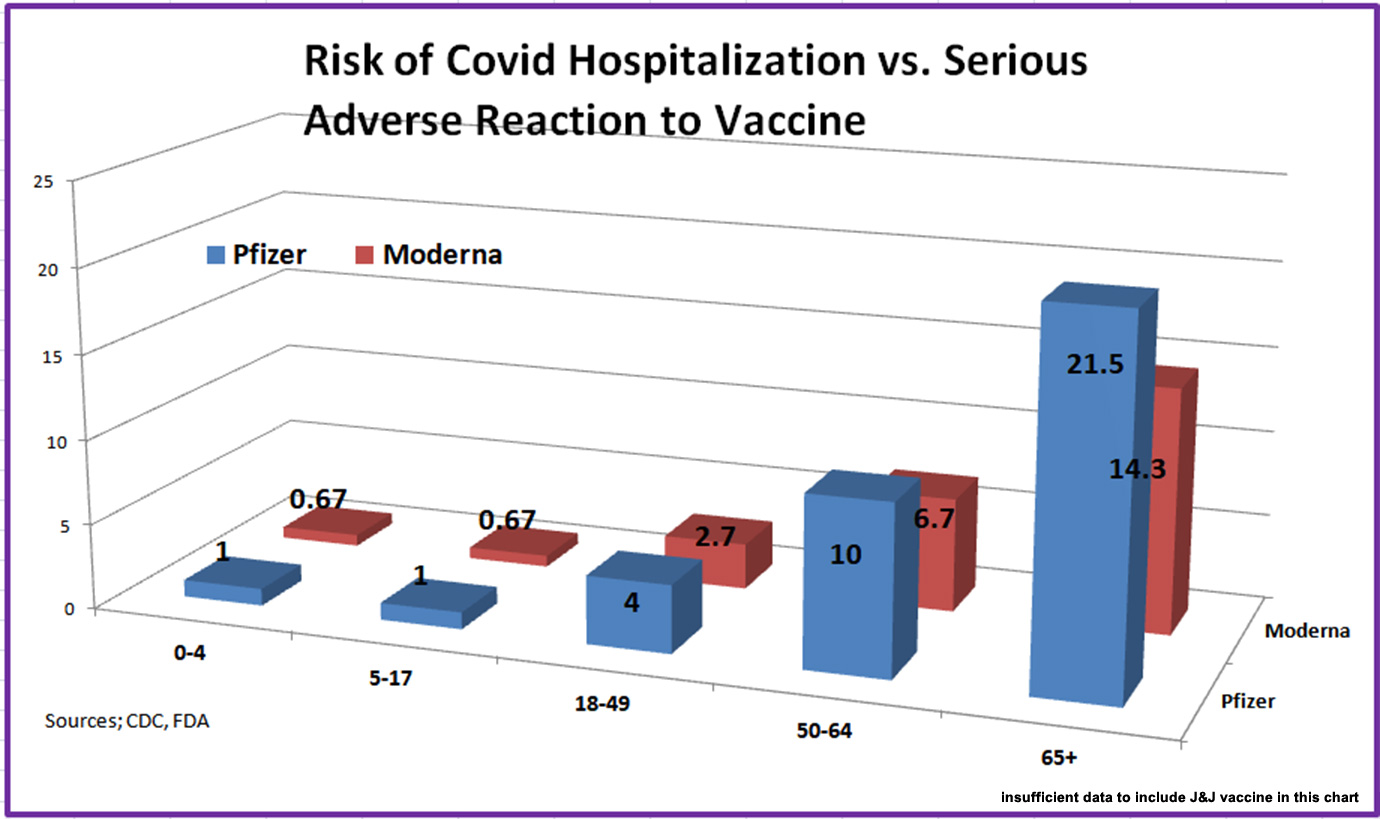
Click above for easy to read large version of Covid Hospitalization vs. Adverse Reaction to Vaccine chart.

Click above for easy to read large version of Covid Hospitalizations per million people (and Covid Adverse Reaction rates)

Click above for easy to read large version of Covid 19 Infections, Illnesses, and Hospitalizations by Age Group.
Data below includes charts on adverse reactions to the various vaccines. Click an image for large view.


We hope this Gardner MA News article has been helpful. Please contact us with comments.
Getting the Covid Vaccine or not?
That is the Question on the minds of many Greater Gardner MA people. The answer is not simple. When comparing data provided by the FDA and CDC regarding the risk of Covid 19 hospitalization vs. the risk of a serious adverse reaction to a vaccine. the answer is easier when asked based on age. For example, the Pfizer vaccine risk is almost the same vs Covid in individuals up to the age of 17. With Moderna, it appears it is riskier for those under 17 to get the vaccine than with getting Covid 19. However, in the 18 to 49 group, Vaccine wins 4-1 with Pfizer and 2.7 to 1 with Moderna. In the 50-64 age group, Vaccine wins 10 to 1 with Pfizer and 6.7 to 1 with Moderna. Lastly in the 65+ group, Vaccine wins 21.5 to 1 with Pfizer and 14.3 to 1 with Moderna. We couldn’t find good J& J data. What we have not considered in the math is that the risk of death from a serious adverse reaction to the vaccine is much less than the risk of death after hospitalization from covid. We don’t have those exact numbers.
There is concerning data in the 18 to 49 group. 1. Why is it such a large group? 2. Would there be a disparity among the ages in the group if the data was separated 18 to 25, 25 to 34, and 35 to 49? We don’t have the answer to the questions, but the answer could help decision-making. Overall, it makes sense for older adults over 50 to get the vaccine. It may make sense for those 18 to 49 – data is not clear because the FDA and CDC have lumped so much together, not revealing enough data . For those under 18, there is clearly no advantage (based on this odds data) to get the vaccine vs. not. With all of that outlined, when you consider that there is a much lower death rate from a vaccine adverse reaction than from a covid hospitalization, it could be argued that getting the vaccine is appropriate for everyone. More transparent data would be helpful to quell concerns and provide better numbers.
Risk of Death from Covid: In the CDC document included below, with the 18-29 age group used as reference, covid risk by age group is 30-39: 4x, 40-49: 10x, 50-64: 35x, 65-74: 95x, 75-84: 230x, and 85+: 610x
Please ask your medical professional regarding your specific situation . CDC docs: 1. Estimated Disease Burden — 2. Reactions Pfizer — 3. Risk for Covid Infection, Hospitalization, Death — Another Document: Nature.com re Mortality Risk *****Read this post on separate page
Conclusion: If over 50, it’s clear getting the vaccine makes sense. Under 50, look at the data. The overall math still favors a YES to getting the Covid vaccine. Talk to your doctor.
