
Gardner Police Department Efforts are Paying Off with less CRIME
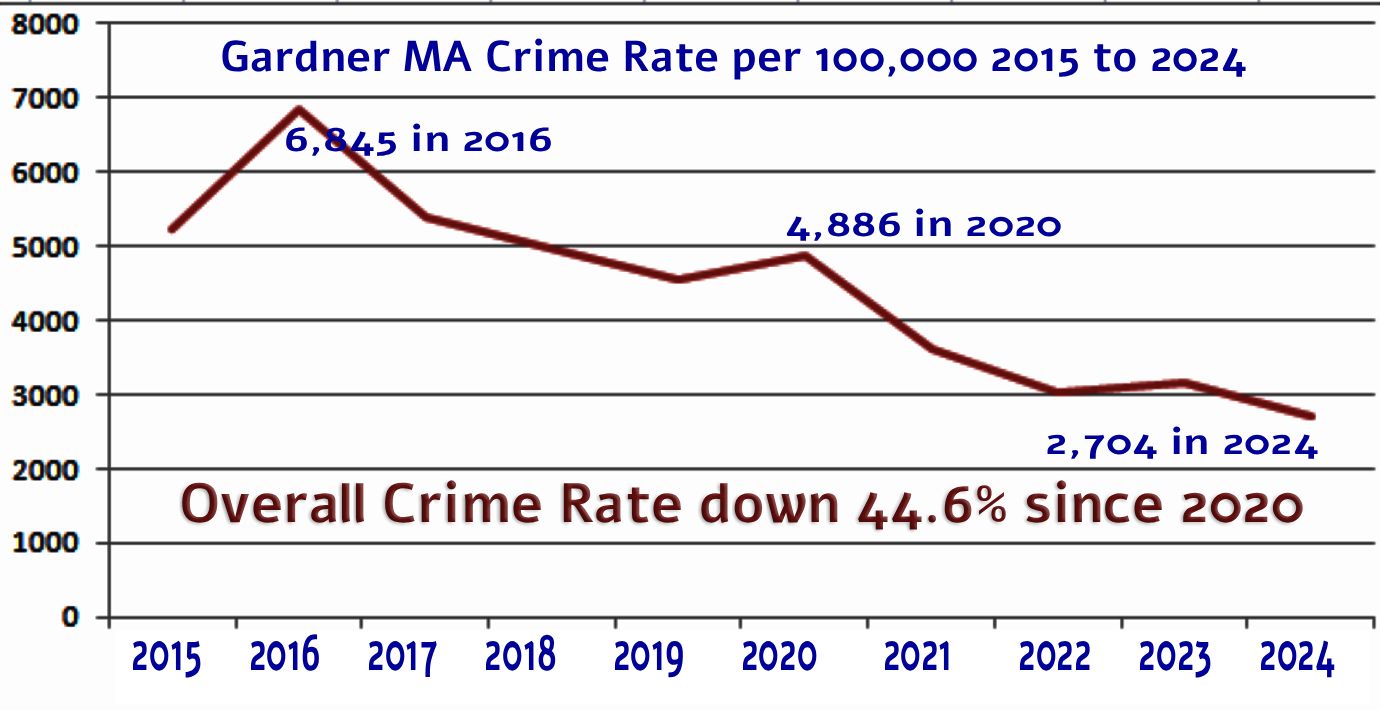
Overall crime in Gardner since Mayor Michael Nicholson took office is down by almost half, 44.6% in 2024 vs. 2020. Our chart shows the overall crime rate per 100,000 people (the manner in which stats are quoted) See 2024 Stats on pdf, CLICK HERE.
Overall Crime Rate per 100,000 people by year in Gardner since 2000
2000: 2353, 2001: 2914, 2002: 6939, 2003: 7961, 2004: 7288, 2005: 7643, 2006: 8176.34, 2007: 7333, 2008: 7890, 2009: 6877, 2010: 7796, 2011: 8157, 2012: 7549, 2013: 7040, 2014: 7321, 2015: 5218, 2016: 6845, 2017: 5392, 2018: 4960, 2019: 4547, 2020: 4886, 2021: 3611, 2022: 3019, 2023: 3151, 2024: 2704
Comparison to other Cities and Towns in Massachusetts and the region
2024 crime rate in Boston was 6618 vs. 6193 in 2020, Worcester the 2024 crime rate was 1217 vs. 5929 in 2020, Fitchburg the 2024 crime rate was 4975 vs. 4937 in 2020. Leominster the 2024 crime rate was 4459 vs 6045 in 2020 —- Locally, 2024 crime rates were: Winchendon – 3102, Westminster – 1854, Ashburnham – 1571, Templeton – 1068 Look up your community at this link, CLICK HERE – This resource was recommended by the Mass.gov crime stats page, CLICK HERE.
State of Massachusetts Statistics
Gardner has a lower crime rate than the Massachusetts average and the state of Massachusetts has a lower crime rate than the national average. The State of MA issued a Press Release in July – see complete on pdf – stating the following in part: “As communities across Massachusetts prepare for the busy July 4th holiday and the peak summer season, the Healey-Driscoll Administration announced preliminary 2024 crime statistics, showing continued progress in enhancing public safety and reducing crime across Massachusetts. According to early data submitted to the FBI’s Uniform Crime Reporting (UCR) Program, the National Incident-Based Reporting System (NIBRS), Part One crimes in Massachusetts declined in 2024 by 4.4% compared to 2023, with total NIBRS offenses dropping by 6.5%.”